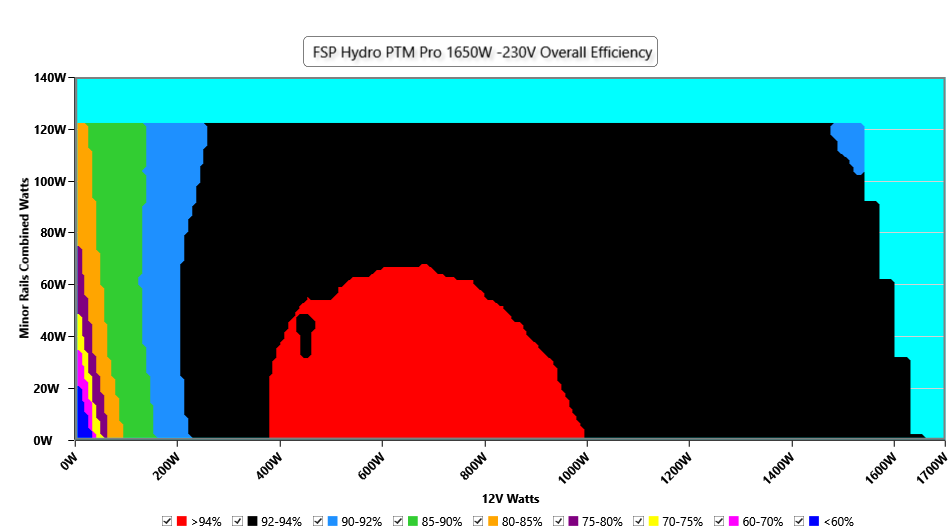
This graph depicts the PSU`s efficiency throughout its entire operational range. For the generation of the efficiency and noise graphs we set our loaders to auto mode through our custom-made software before trying thousands of possible load combinations
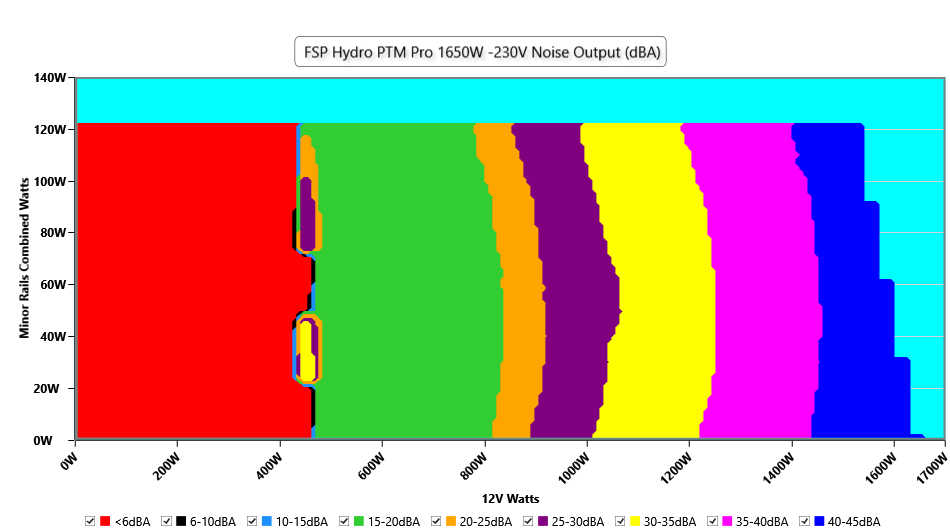
Noise Graph
230V
INFO
The PSU`s noise in its entire operational range and under 30-32 °C ambient is depicted in this graph. The X axis represents the load on the +12V rail(s) while the Y axis is the load on the minor rails
Conducted Emissions EN55032 & CISPR 32
Indicative Performance
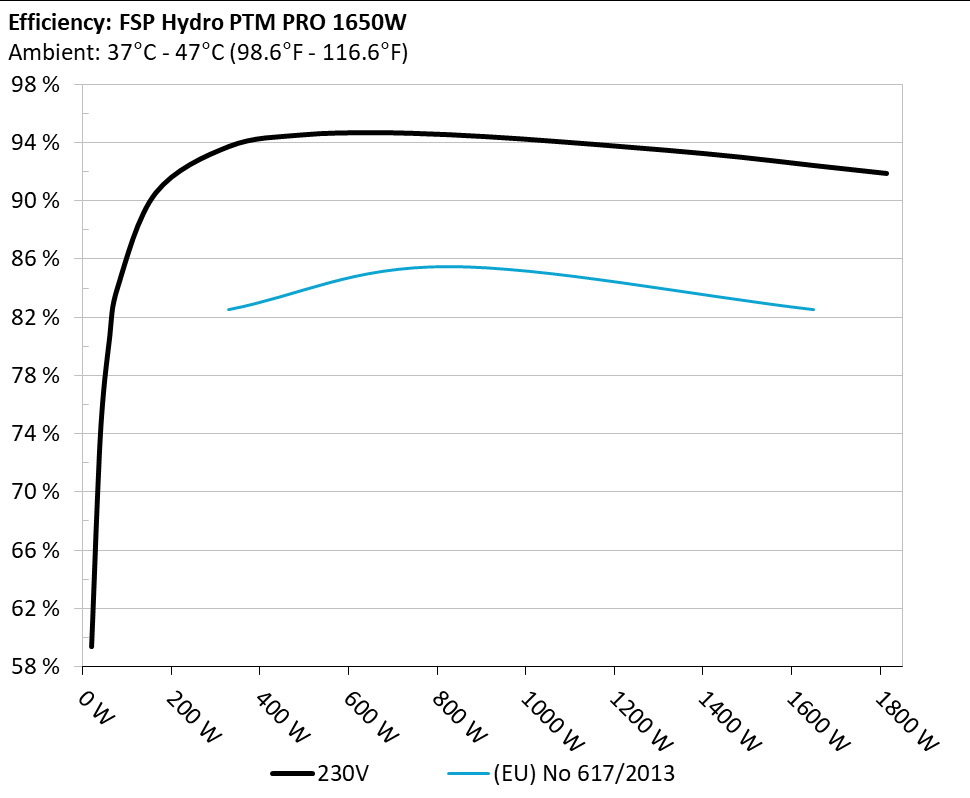
Efficiency under high ambient temperature
INFO
The PSU`s efficiency under high ambient temperatures with 115V and 230V input. For this graph the results of the 10-110% load regulation table are used
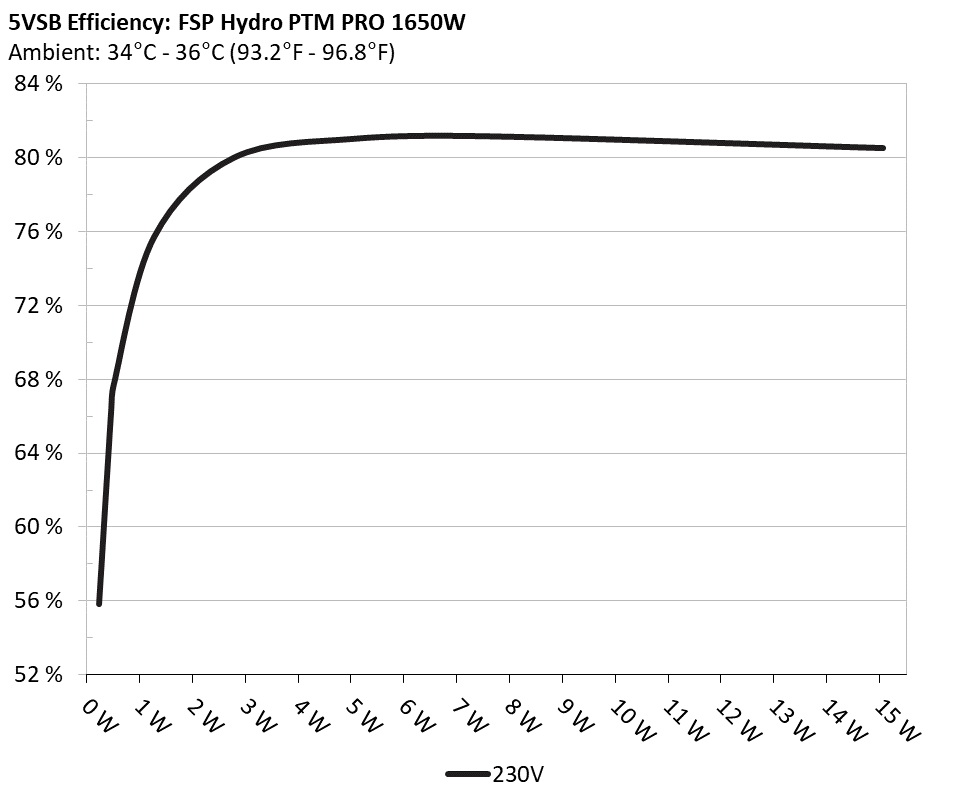
5VSB Efficiency
INFO
This graph depicts the efficiency levels of the 5VSB rail with 115V and 230V input
12V to Earth: ✓ 5V to Earth: ✓ 3.3V to Earth: ✓ 5VSB to Earth: ✓ -12V to Earth: ✓
PWR_OK
Proper Operation
NLO
✓
Fan Failure Protection
✗
SIP
Surge: MOV Inrush: NTC & Bypass Relay
Supplementary Tests (For Reference)
Typical Load Tests 230V
Test
12V
5V
3.3V
5VSB
DC/AC (Watts)
Efficiency
Fan Speed (RPM)
PSU Noise (dB[A])
Temps (In/Out)
PF/AC Volts
10%
11.803A
1.968A
1.943A
0.991A
164.957
90.06%
0
<6.0
43.79°C
0.936
12.146V
5.08V
3.397V
5.048V
183.177
40.46°C
229.81V
20%
24.638A
2.954A
2.916A
1.191A
329.956
93.243%
0
<6.0
42.77°C
0.98
12.138V
5.077V
3.395V
5.036V
353.868
40.89°C
229.78V
30%
37.793A
3.448A
3.405A
1.393A
494.387
94.035%
643
18.7
41.06°C
0.99
12.127V
5.075V
3.392V
5.024V
525.695
43.39°C
229.76V
40%
51.036A
3.943A
3.893A
1.596A
659.637
94.188%
679
20.5
41.65°C
0.993
12.117V
5.073V
3.391V
5.012V
700.346
43.39°C
229.73V
50%
63.957A
4.931A
4.87A
1.8A
824.923
94.052%
816
25.6
42.36°C
0.994
12.108V
5.07V
3.388V
5V
877.093
44°C
229.71V
60%
76.827A
5.921A
5.848A
2A
989.46
93.765%
1006
32
42.83°C
0.994
12.101V
5.067V
3.386V
4.988V
1055.253
44.59°C
229.68V
70%
89.776A
6.912A
6.828A
2.211A
1154.86
93.385%
1214
37
43.05°C
0.994
12.093V
5.065V
3.384V
4.975V
1236.857
45.54°C
229.67V
80%
102.755A
7.903A
7.808A
2.317A
1319.65
92.98%
1399
40.7
43.95°C
0.995
12.085V
5.062V
3.381V
4.964V
1419.288
45.78°C
229.62V
90%
116.126A
8.4A
8.286A
2.424A
1485.073
92.507%
1614
44.5
44.2°C
0.995
12.078V
5.059V
3.379V
4.953V
1605.369
47.36°C
229.59V
100%
129.242A
8.898A
8.794A
3.042A
1649.864
91.936%
1783
47
45.67°C
0.994
12.072V
5.057V
3.377V
4.933V
1794.559
48.39°C
229.57V
110%
142.262A
9.893A
9.867A
3.047A
1814.458
91.388%
1945
48.9
46.78°C
0.994
12.063V
5.054V
3.375V
4.923V
1985.446
49.41°C
229.53V
CL1
0.116A
14.269A
14.108A
0A
121.316
82.944%
0
<6.0
43.06°C
0.901
12.160V
5.06V
3.381V
5.063V
146.263
43.6°C
229.81V
CL2
0.115A
19.761A
0A
0.001A
101.359
80.736%
0
<6.0
41.88°C
0.867
12.163V
5.058V
3.392V
5.066V
125.543
41.09°C
229.82V
CL3
0.114A
0A
19.528A
0A
67.388
74.242%
0
<6.0
42.36°C
0.807
12.163V
5.077V
3.38V
5.067V
90.776
44.09°C
229.83V
CL4
136.589A
0A
0A
0.001A
1649.579
92.295%
1816
47.4
44.42°C
0.994
12.077V
5.075V
3.39V
4.988V
1787.297
48.64°C
229.56V
The results above are not used in the certification process
Light Load Tests 230V
Test
12V
5V
3.3V
5VSB
DC/AC (Watts)
Efficiency
Fan Speed (RPM)
PSU Noise (dB[A])
Temps (In/Out)
PF/AC Volts
20W
1.222A
0.492A
0.485A
0.197A
20
58.873%
0
<6.0
38.46°C
0.512
12.147V
5.083V
3.399V
5.069V
33.96
36.77°C
229.84V
40W
2.692A
0.689A
0.68A
0.296A
40
73.483%
0
<6.0
42.29°C
0.673
12.147V
5.082V
3.399V
5.066V
54.431
37.65°C
229.83V
60W
4.160A
0.885A
0.874A
0.395A
59.999
79.929%
0
<6.0
40.69°C
0.753
12.147V
5.081V
3.398V
5.063V
75.065
38.58°C
229.82V
80W
5.624A
1.082A
1.068A
0.494A
79.94
83.669%
0
<6.0
44.77°C
0.815
12.147V
5.081V
3.398V
5.061V
95.547
39.95°C
229.82V
The results above are not used in the certification process
Ripple Measurements 230V
Test
12V
5V
3.3V
5VSB
Pass/Fail
10% Load
16.01mV
15.09mV
14.57mV
10.36mV
Pass
20% Load
18.21mV
16.37mV
15.90mV
12.41mV
Pass
30% Load
13.96mV
14.98mV
13.29mV
12.47mV
Pass
40% Load
16.06mV
16.73mV
16.11mV
14.42mV
Pass
50% Load
18.10mV
19.60mV
17.08mV
15.45mV
Pass
60% Load
16.83mV
18.53mV
16.47mV
16.01mV
Pass
70% Load
15.70mV
18.02mV
15.49mV
15.45mV
Pass
80% Load
19.13mV
24.07mV
21.96mV
18.63mV
Pass
90% Load
21.63mV
24.94mV
23.91mV
19.45mV
Pass
100% Load
29.01mV
29.38mV
27.29mV
24.35mV
Pass
110% Load
29.55mV
28.73mV
25.82mV
25.94mV
Pass
Crossload1
17.54mV
17.14mV
19.14mV
20.68mV
Pass
Crossload2
18.10mV
20.53mV
16.78mV
23.45mV
Pass
Crossload3
15.70mV
15.04mV
18.26mV
22.37mV
Pass
Crossload4
29.10mV
26.59mV
21.93mV
26.42mV
Pass
The results above are not used in the certification process
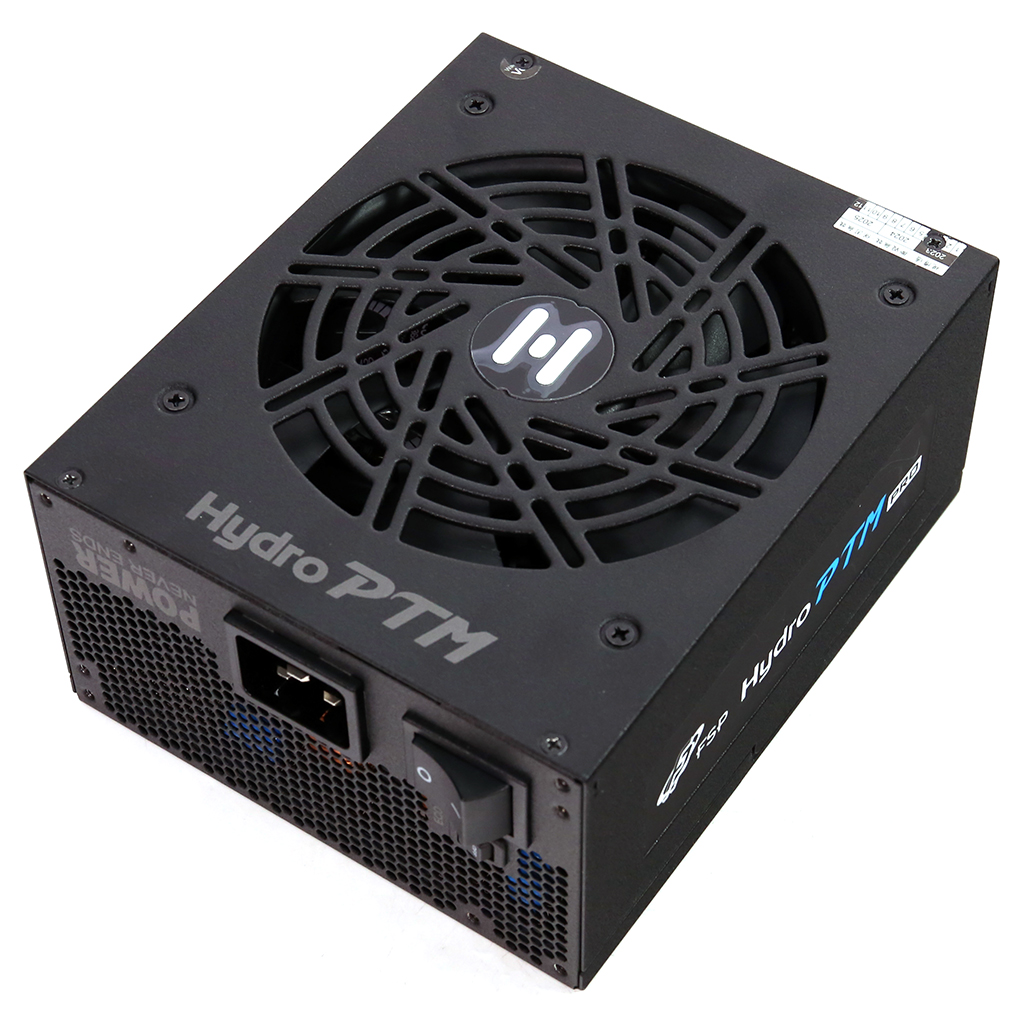
FSP Technology Hydro PTM Pro 1650W (ATXv3.1)
Top side
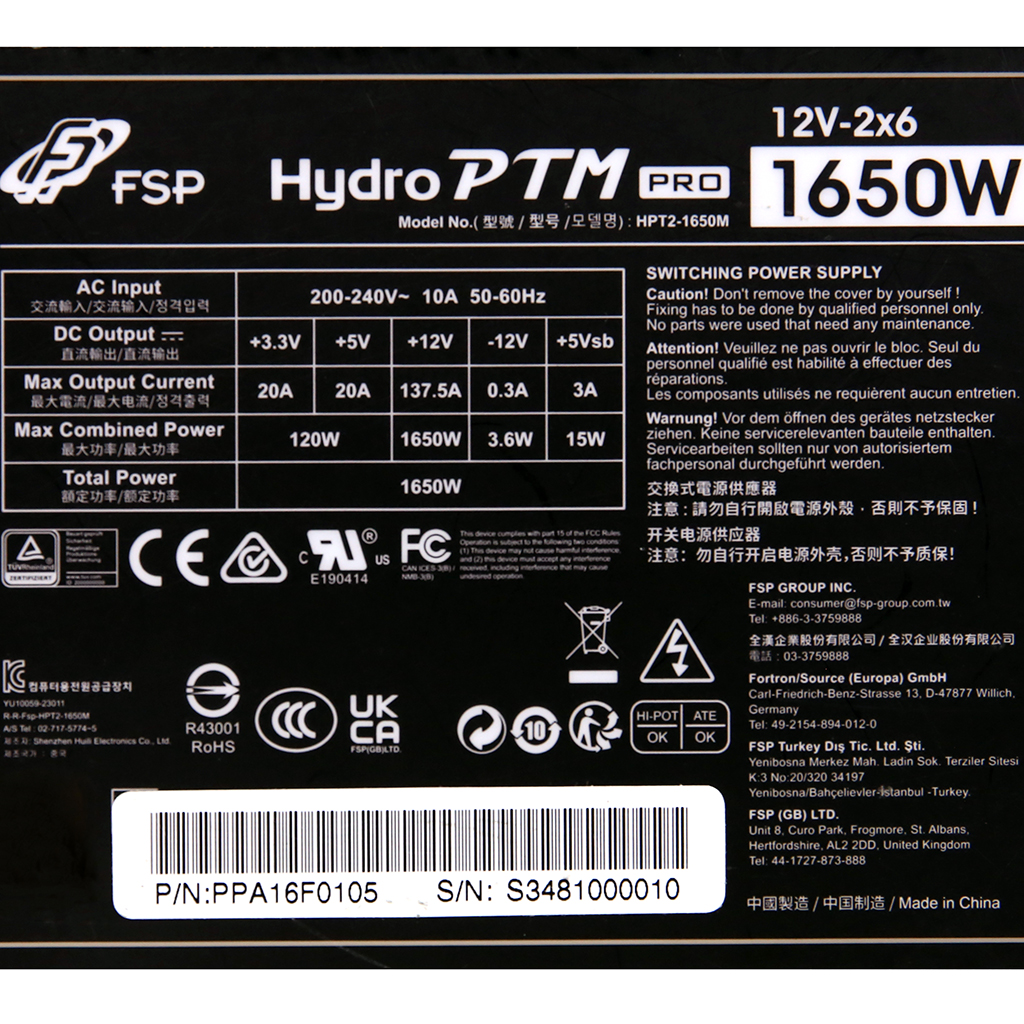
Power specifications label
All data and graphs included in this test report can be used by any individual on the following conditions: › It should be mentioned that the test results are provided by Cybenetics › The link to the original test results document should be provided in any case
Cybenetics offers the ETA and Lambda voluntary certification programs, through which the efficient and silent power supplies are promoted