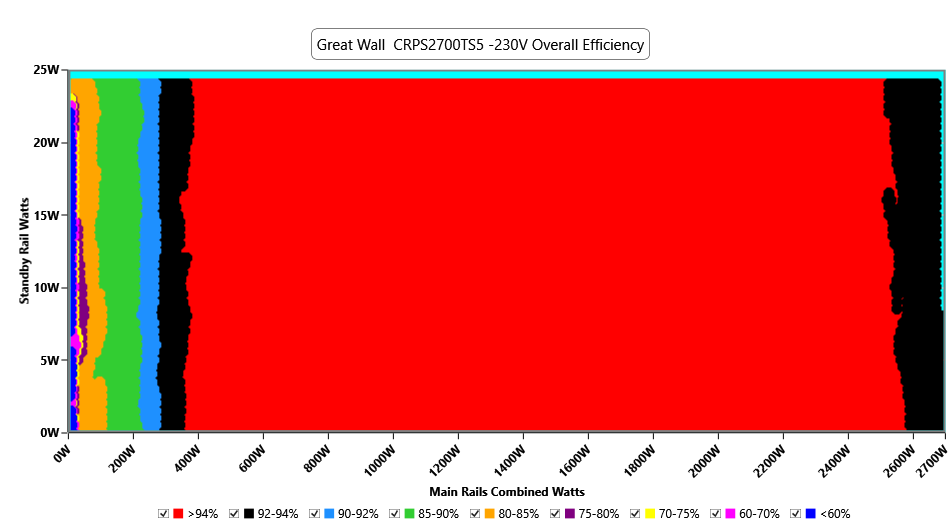
This graph depicts the PSU`s efficiency throughout its entire operational range. For the generation of the efficiency and noise graphs we set our loaders to auto mode through our custom-made software before trying thousands of possible load combinations
Noise Graph
230V
Indicative Performance
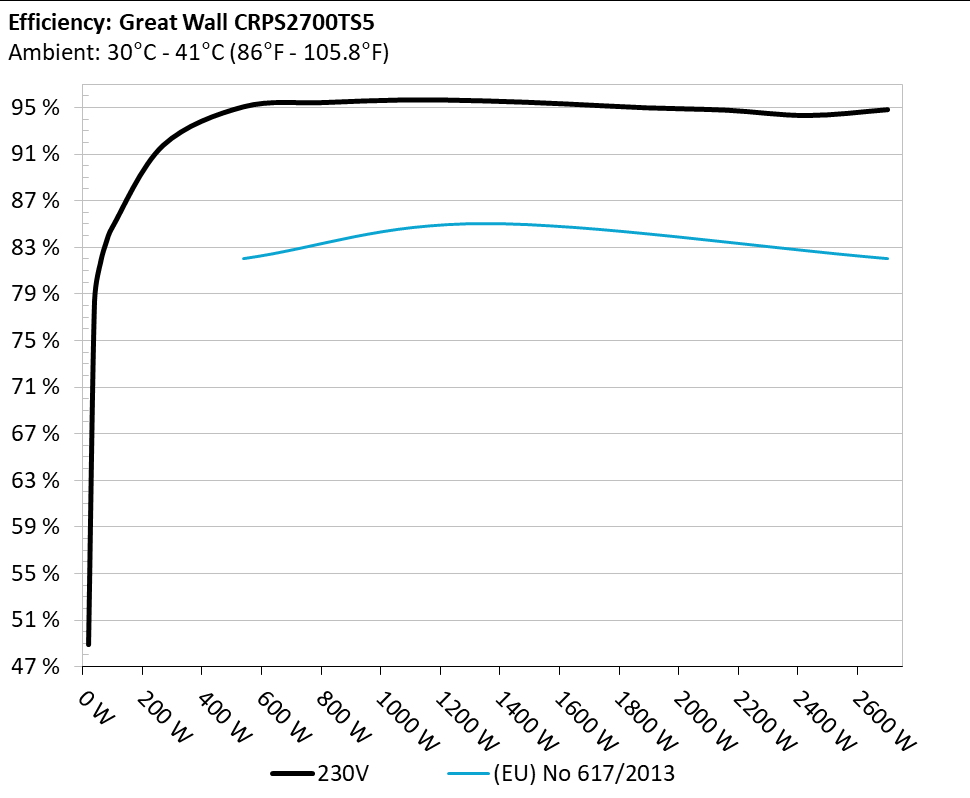
Efficiency under high ambient temperature
INFO
The PSU`s efficiency under high ambient temperatures with 230V input. For this graph, the results of the 10-100% load regulation table are used
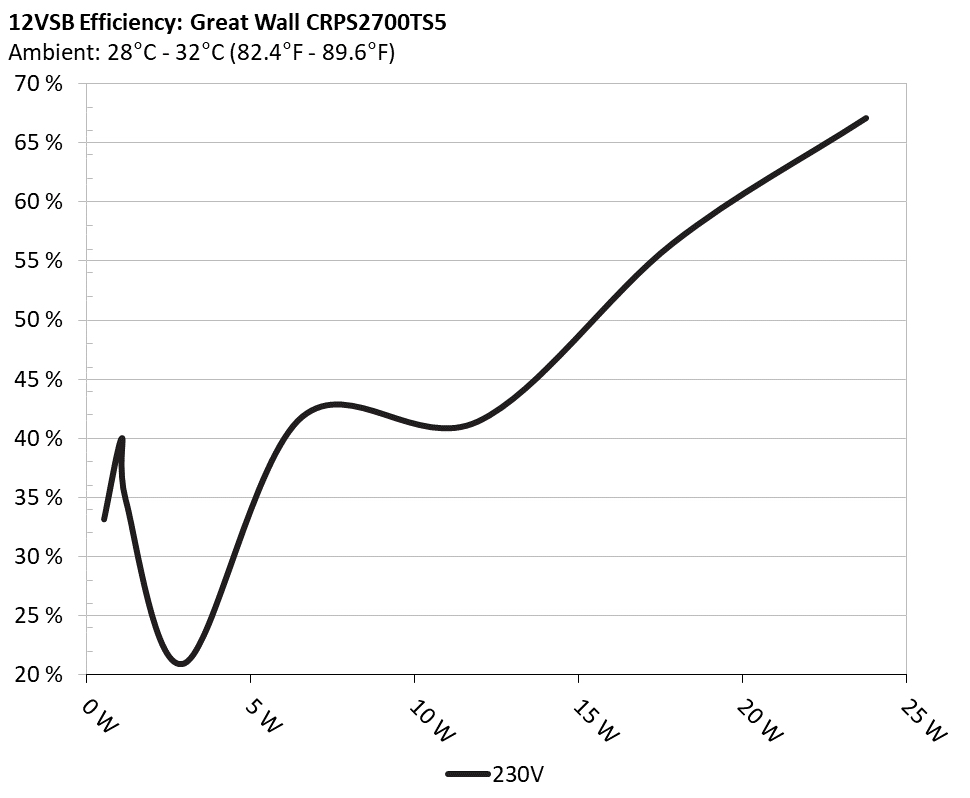
5VSB Efficiency
INFO
This graph depicts the efficiency levels of the 12VSB rail with 230V input
5VSB Efficiency (ERP LOT 3/6 & CEC) 230V
Test #
5VSB
DC/AC (Watts)
Efficiency
PF/AC Volts
1
0.045A
0.54W
33.152%
0.071
11.996V
4.743W
229.84V
2
0.09A
1.08W
40.02%
0.082
11.993V
5.508W
229.84V
3
0.55A
6.582W
41.841%
0.165
11.966V
11.539W
229.84V
4
1A
11.942W
41.438%
0.228
11.941V
17.44W
229.84V
5
1.5A
17.873W
56.512%
0.313
11.914V
24.439W
229.84V
6
2A
23.777W
67.134%
0.38
11.886V
31.465W
229.83V
Supplementary Tests (For Reference)
Typical Load Tests 230V
Test
Main Rail
Standby Rail
DC/AC (Watts)
Efficiency
Temps (In/Out)
PF/AC Volts
10%
4.904A
0.418A
269.967
91.735%
35.2°C
0.952
54.023V
11.969V
294.271
37.71°C
229.79V
20%
9.877A
0.502A
539.505
95.046%
35.85°C
0.984
54.012V
11.959V
567.669
37.97°C
229.76V
30%
14.867A
0.586A
809.781
95.412%
36.16°C
0.994
53.998V
11.948V
848.499
39.69°C
229.7V
40%
19.865A
0.67A
1080.501
95.639%
36.65°C
0.996
53.990V
11.938V
1129.772
40.93°C
229.67V
50%
24.857A
0.755A
1350.8
95.555%
37.07°C
0.997
53.982V
11.927V
1413.642
41.81°C
229.63V
60%
29.845A
0.839A
1620.803
95.295%
35.97°C
0.998
53.973V
11.916V
1700.862
42.39°C
229.58V
70%
34.838A
0.924A
1891.004
94.96%
35.1°C
0.998
53.964V
11.905V
1991.352
42.59°C
229.52V
80%
39.832A
0.967A
2160.343
94.758%
32.06°C
0.998
53.948V
11.895V
2279.84
38.9°C
229.49V
90%
44.844A
1.01A
2430.865
94.298%
33.98°C
0.998
53.939V
11.887V
2577.4
41.91°C
229.43V
100%
49.610A
2.03A
2699.74
94.799%
35.75°C
0.988
53.930V
11.824V
2874.2
42.26°C
229.54V
The results above are not used in the certification process
Light Load Tests 230V
Test
Main Rail
Standby Rail
DC/AC (Watts)
Efficiency
Temps (In/Out)
PF/AC Volts
20W
0.352A
0.083A
20.009
48.871%
30.98°C
0.342
54.027V
11.994V
28.598
33.38°C
229.84V
40W
0.712A
0.125A
40.013
78.392%
31.07°C
0.54
54.033V
11.991V
51.065
33.56°C
229.85V
60W
1.074A
0.167A
60.012
81.664%
32.19°C
0.687
54.031V
11.988V
73.474
34.74°C
229.82V
80W
1.433A
0.209A
79.916
83.48%
33.03°C
0.763
54.030V
11.985V
95.712
35.41°C
229.82V
The results above are not used in the certification process
Ripple Measurements 230V
Test
Main Rail
Standby Rail
Pass/Fail (Limit: 540mV)
10% Load
79.1 mV
43.4 mV
Pass
20% Load
110.0 mV
47.8 mV
Pass
30% Load
77.4 mV
48.1 mV
Pass
40% Load
113.3 mV
57.9 mV
Pass
50% Load
120.2 mV
58.7 mV
Pass
60% Load
134.3 mV
72.8 mV
Pass
70% Load
147.3 mV
81.8 mV
Pass
80% Load
157.3 mV
77.1 mV
Pass
90% Load
164.1 mV
86.0 mV
Pass
100% Load
143.7 mV
112.4 mV
Pass
The results above are not used in the certification process
Great Wall CRPS2700TS5
Top side
Power specifications label
All data and graphs included in this test report can be used by any individual on the following conditions: › It should be mentioned that the test results are provided by Cybenetics › The link to the original test results document should be provided in any case
Cybenetics offers the ETA and Lambda voluntary certification programs, through which the efficient and silent power supplies are promoted