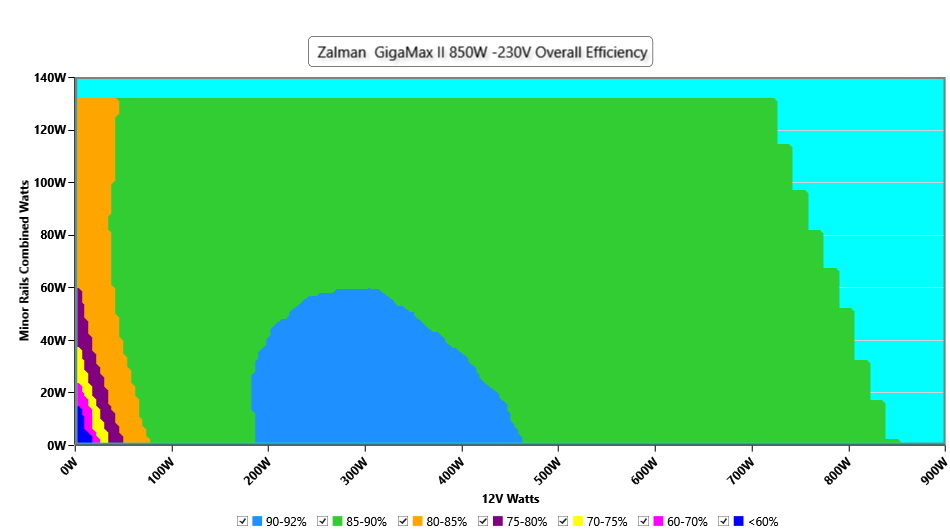
This graph depicts the PSU`s efficiency throughout its entire operational range. For the generation of the efficiency and noise graphs we set our loaders to auto mode through our custom-made software before trying thousands of possible load combinations
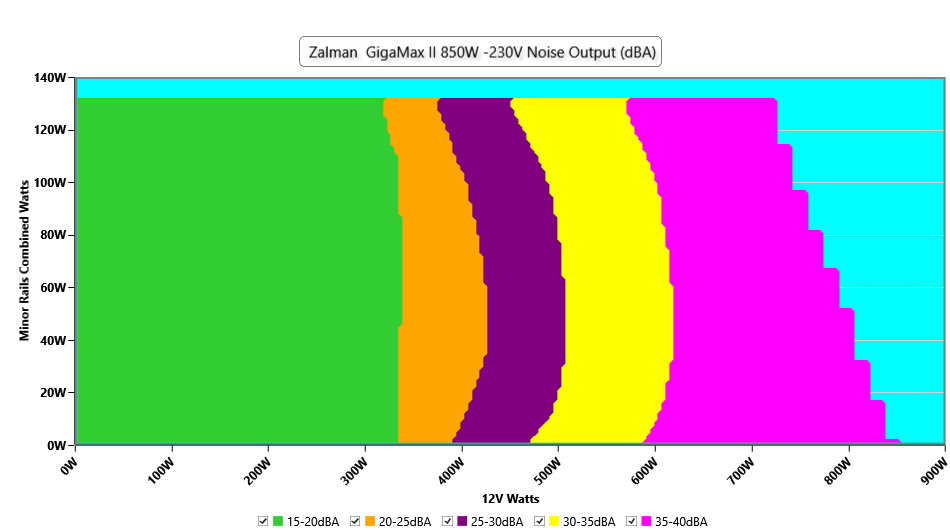
Noise Graph
230V
INFO
The PSU`s noise in its entire operational range and under 30-32 °C ambient is depicted in this graph. The X axis represents the load on the +12V rail(s) while the Y axis is the load on the minor rails
Indicative Performance
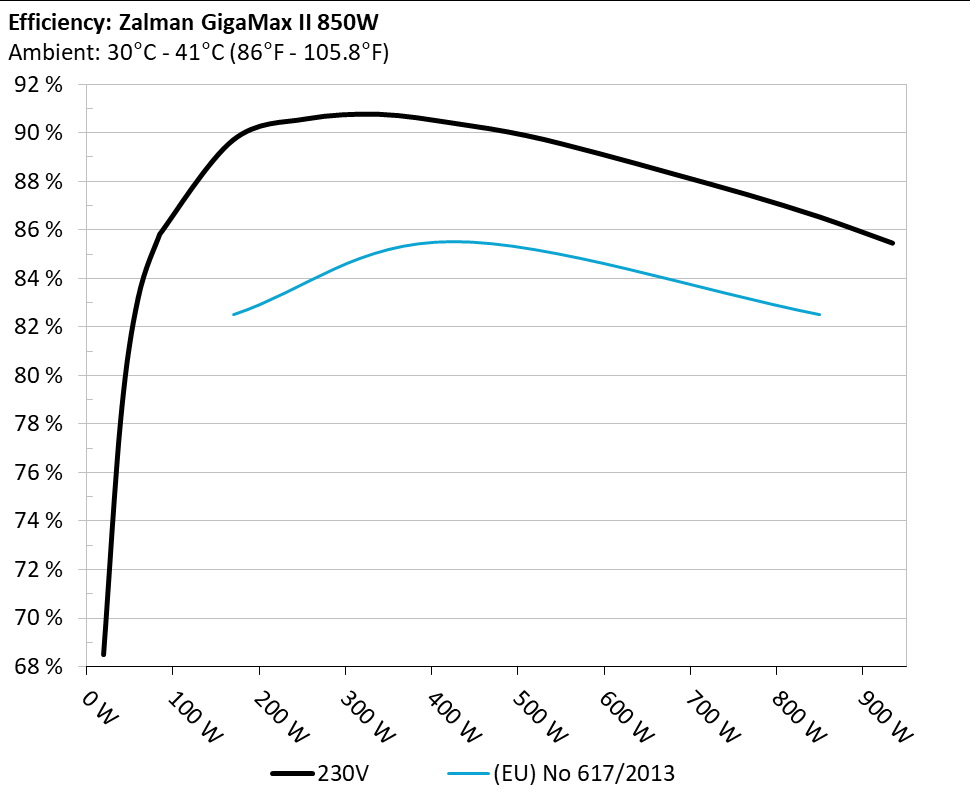
Efficiency under high ambient temperature
INFO
The PSU`s efficiency under high ambient temperatures with 115V and 230V input. For this graph the results of the 10-110% load regulation table are used
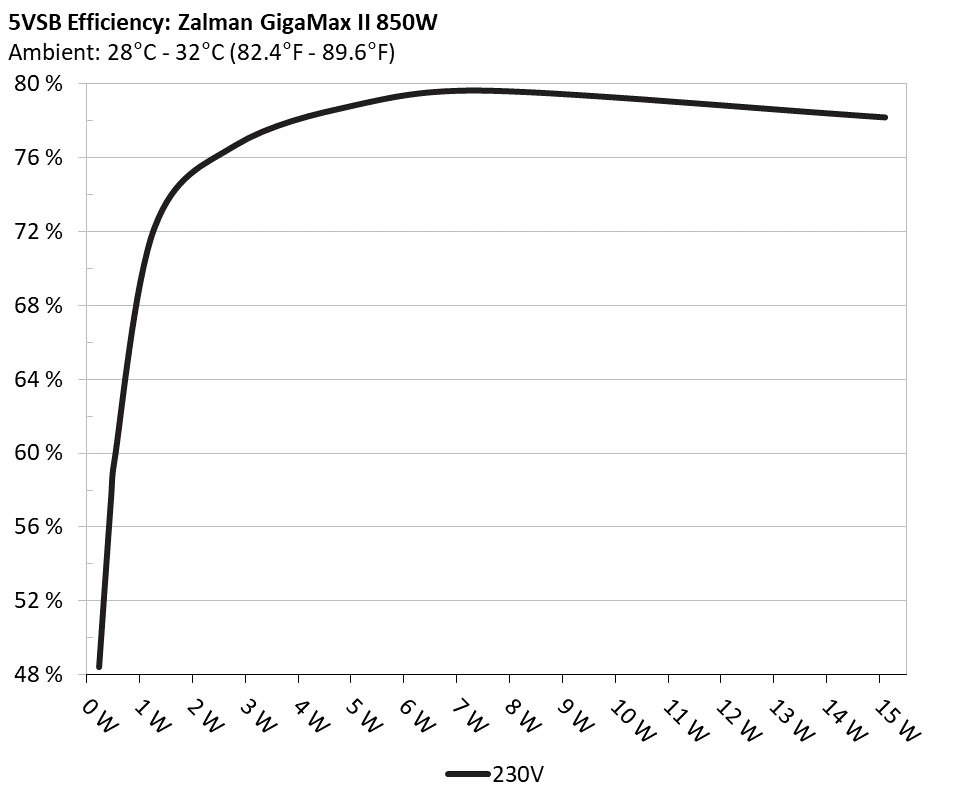
5VSB Efficiency
INFO
This graph depicts the efficiency levels of the 5VSB rail with 115V and 230V input
5VSB Efficiency (ERP LOT 3/6 & CEC) 230V
Test #
5VSB
DC/AC (Watts)
Efficiency
PF/AC Volts
1
0.045A
0.23W
48.644%
0.016
5.119V
0.473W
229.79V
2
0.09A
0.461W
57.978%
0.026
5.119V
0.796W
229.81V
3
0.55A
2.808W
76.856%
0.114
5.106V
3.654W
229.8V
4
1A
5.093W
79.043%
0.182
5.093V
6.443W
229.79V
5
1.5A
7.619W
79.814%
0.211
5.079V
9.547W
229.79V
6
3A
15.104W
78.37%
0.313
5.035V
19.272W
229.79V
Supplementary Tests (For Reference)
Typical Load Tests 230V
Test
12V
5V
3.3V
5VSB
DC/AC (Watts)
Efficiency
Fan Speed (RPM)
PSU Noise (dB[A])
Temps (In/Out)
PF/AC Volts
10%
5.192A
1.959A
1.967A
0.984A
84.999
85.303%
771
19.5
34.21°C
0.864
12.211V
5.104V
3.356V
5.08V
99.644
38.42°C
229.78V
20%
11.400A
2.948A
2.961A
1.185A
169.936
89.213%
773
19.6
34.5°C
0.941
12.196V
5.088V
3.344V
5.064V
190.484
39.16°C
229.77V
30%
17.970A
3.448A
3.465A
1.387A
254.942
90.09%
775
19.6
35.19°C
0.963
12.181V
5.075V
3.334V
5.049V
282.987
40.27°C
229.75V
40%
24.563A
3.95A
3.971A
1.59A
340.025
90.275%
780
19.7
35.86°C
0.973
12.166V
5.063V
3.324V
5.033V
376.654
41.31°C
229.74V
50%
30.807A
4.954A
4.983A
1.794A
424.82
89.915%
1001
26.4
36.4°C
0.979
12.150V
5.047V
3.311V
5.016V
472.467
42.26°C
229.72V
60%
37.045A
5.965A
6.001A
2A
509.347
89.404%
1248
31.1
36.53°C
0.983
12.135V
5.03V
3.299V
5V
569.715
42.82°C
229.71V
70%
43.367A
6.982A
7.025A
2.208A
594.654
88.655%
1452
35.9
37.32°C
0.985
12.119V
5.013V
3.289V
4.983V
670.754
44.35°C
229.69V
80%
49.712A
8.001A
8.056A
2.316A
679.479
87.827%
1626
38.8
37.92°C
0.987
12.102V
4.996V
3.277V
4.966V
773.661
45.99°C
229.67V
90%
56.470A
8.529A
8.572A
2.424A
764.93
86.976%
1771
40.9
38.45°C
0.989
12.085V
4.982V
3.266V
4.951V
879.477
47.54°C
229.65V
100%
62.980A
9.057A
9.126A
3.049A
849.74
86.044%
1845
43.5
39.39°C
0.991
12.068V
4.968V
3.254V
4.92V
987.567
49.43°C
229.63V
110%
69.373A
10.105A
10.281A
3.057A
934.32
84.968%
1852
43.7
40.59°C
0.992
12.051V
4.947V
3.239V
4.907V
1099.62
51.52°C
229.62V
CL1
0.114A
15.772A
15.731A
0.001A
131.299
82.212%
796
20.0
34.56°C
0.926
12.207V
4.964V
3.281V
5.083V
159.709
39.98°C
229.76V
CL2
0.113A
20.053A
0A
0A
101.341
81.707%
774
19.6
34.53°C
0.898
12.216V
4.984V
3.316V
5.097V
124.032
41.55°C
229.77V
CL3
0.113A
0A
20.035A
0.001A
67.4
76.213%
769
19.5
34.34°C
0.842
12.215V
5.049V
3.295V
5.098V
88.438
43.43°C
229.78V
CL4
70.379A
0A
0A
0.001A
849.535
86.094%
1810
42.0
39.33°C
0.991
12.071V
5.054V
3.295V
5.029V
986.761
50.29°C
229.64V
The results above are not used in the certification process
Light Load Tests 230V
Test
12V
5V
3.3V
5VSB
DC/AC (Watts)
Efficiency
Fan Speed (RPM)
PSU Noise (dB[A])
Temps (In/Out)
PF/AC Volts
20W
1.215A
0.488A
0.49A
0.196A
20.003
68.007%
764
19.4
30.01°C
0.528
12.225V
5.124V
3.369V
5.11V
29.413
33.1°C
229.78V
40W
2.676A
0.683A
0.686A
0.294A
39.998
77.774%
763
19.4
31.29°C
0.706
12.218V
5.121V
3.367V
5.106V
51.428
34.6°C
229.78V
60W
4.136A
0.879A
0.883A
0.392A
59.995
82.701%
764
19.4
32.06°C
0.798
12.215V
5.117V
3.364V
5.101V
72.544
35.57°C
229.78V
80W
5.594A
1.075A
1.08A
0.491A
79.938
85.335%
768
19.5
33.08°C
0.853
12.212V
5.113V
3.361V
5.096V
93.678
36.89°C
229.79V
The results above are not used in the certification process
Ripple Measurements 230V
Test
12V
5V
3.3V
5VSB
Pass/Fail
10% Load
14.02mV
13.08mV
16.42mV
14.22mV
Pass
20% Load
14.07mV
14.31mV
17.70mV
14.63mV
Pass
30% Load
14.58mV
15.27mV
18.21mV
17.03mV
Pass
40% Load
16.01mV
16.04mV
19.13mV
18.52mV
Pass
50% Load
18.47mV
17.06mV
20.21mV
21.13mV
Pass
60% Load
15.45mV
14.40mV
18.62mV
19.23mV
Pass
70% Load
22.66mV
19.16mV
22.82mV
21.53mV
Pass
80% Load
26.91mV
19.57mV
27.78mV
23.84mV
Pass
90% Load
31.77mV
20.59mV
28.80mV
21.89mV
Pass
100% Load
39.99mV
26.77mV
31.79mV
31.65mV
Pass
110% Load
45.86mV
25.94mV
33.77mV
29.83mV
Pass
Crossload1
17.55mV
20.66mV
22.73mV
16.28mV
Pass
Crossload2
16.22mV
22.32mV
18.62mV
14.22mV
Pass
Crossload3
13.66mV
12.67mV
21.18mV
14.73mV
Pass
Crossload4
43.34mV
24.99mV
24.40mV
23.69mV
Pass
The results above are not used in the certification process
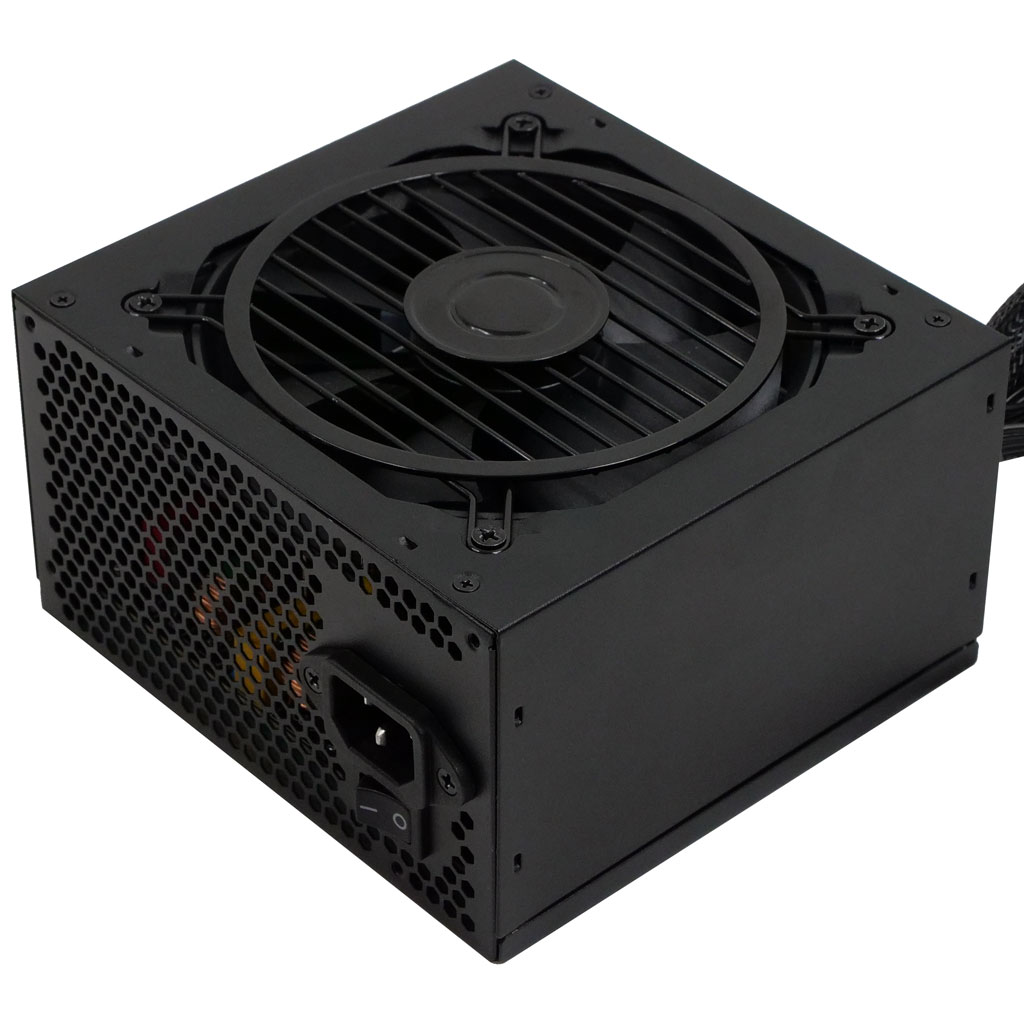
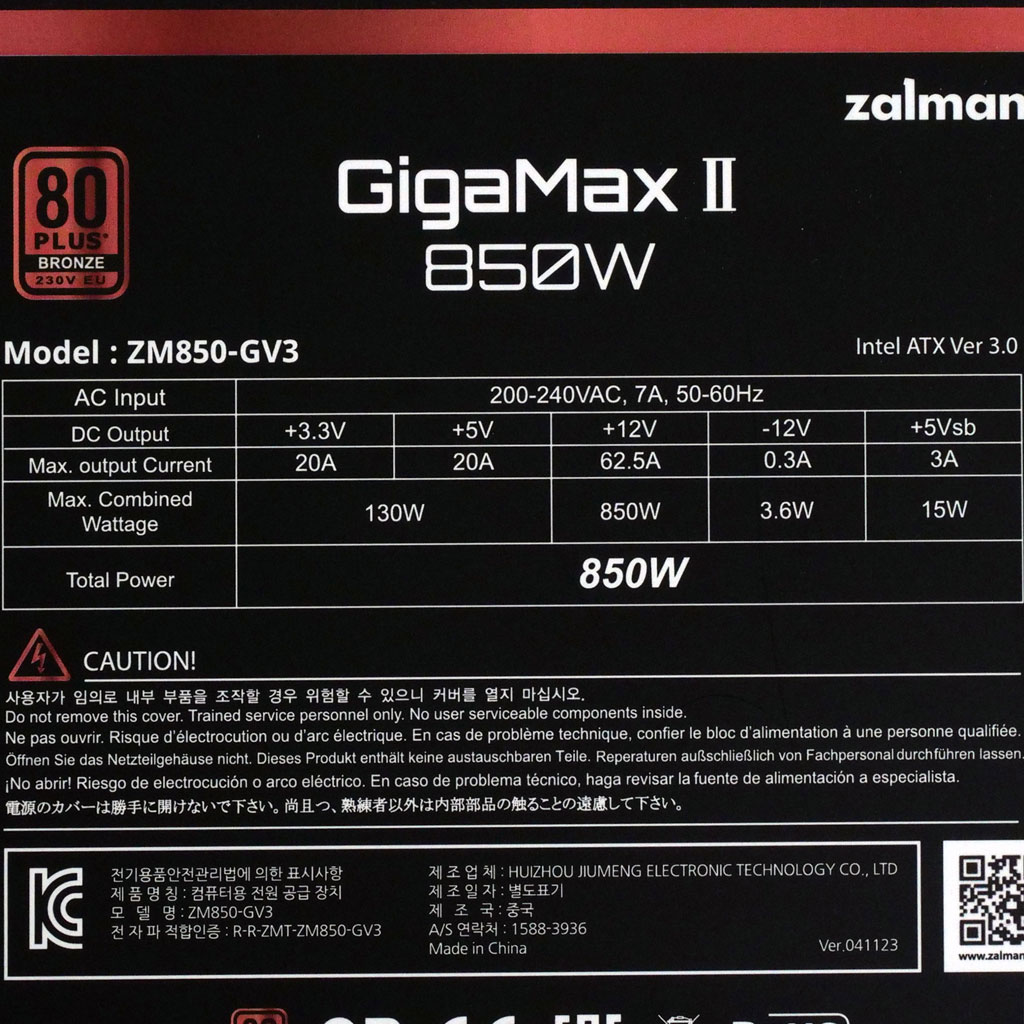
Zalman GigaMax III 850W
Top side
Power specifications label
All data and graphs included in this test report can be used by any individual on the following conditions: › It should be mentioned that the test results are provided by Cybenetics › The link to the original test results document should be provided in any case
Cybenetics offers the ETA and Lambda voluntary certification programs, through which the efficient and silent power supplies are promoted