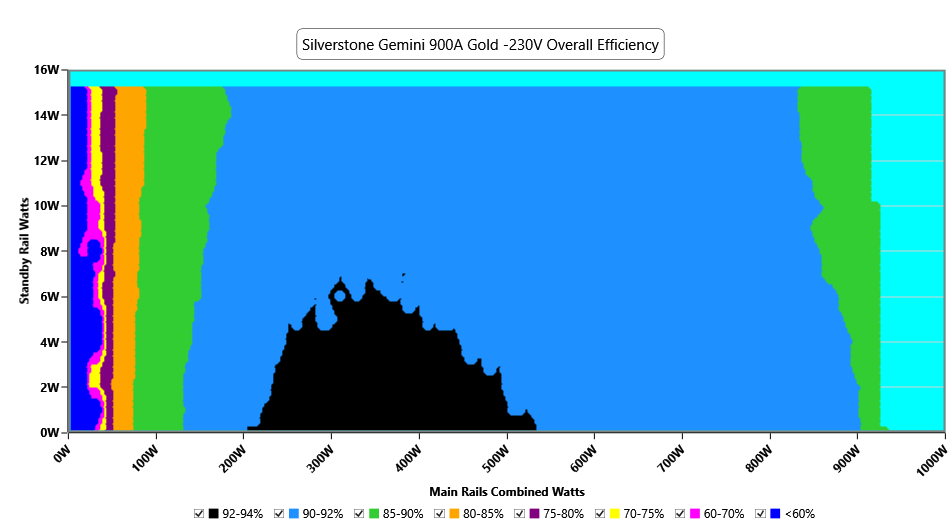
This graph depicts the PSU`s efficiency throughout its entire operational range. For the generation of the efficiency and noise graphs we set our loaders to auto mode through our custom-made software before trying thousands of possible load combinations
Noise Graph
230V
Indicative Performance
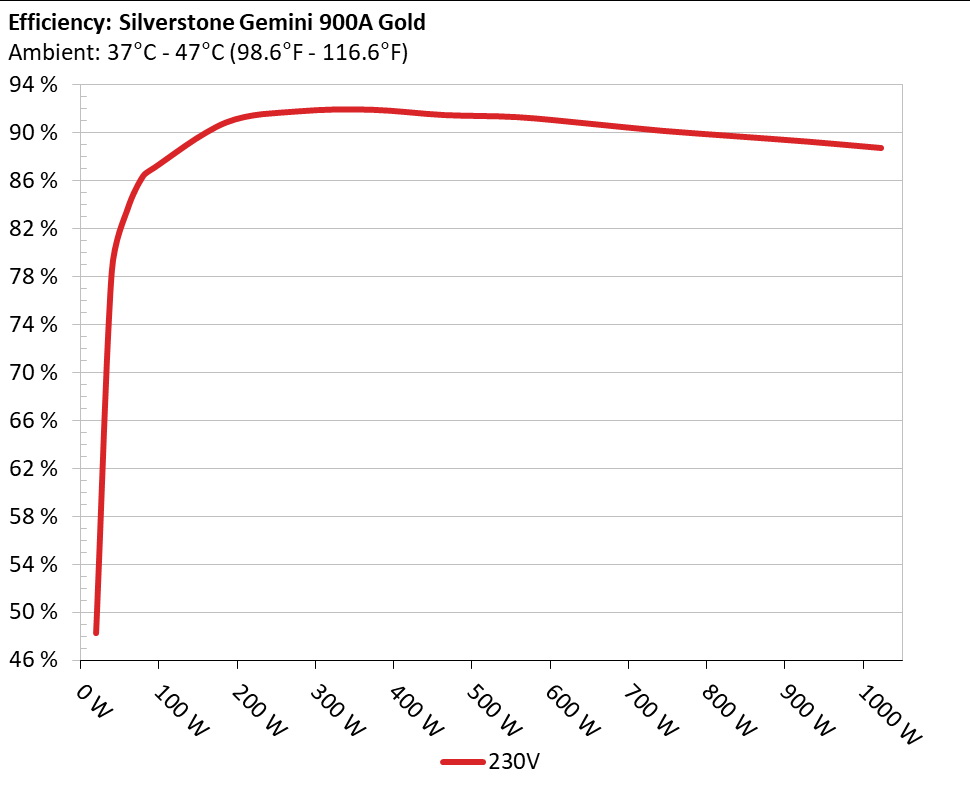
Efficiency under high ambient temperature
INFO
The PSU`s efficiency under high ambient temperatures with 115V and 230V input. For this graph the results of the 10-110% load regulation table are used
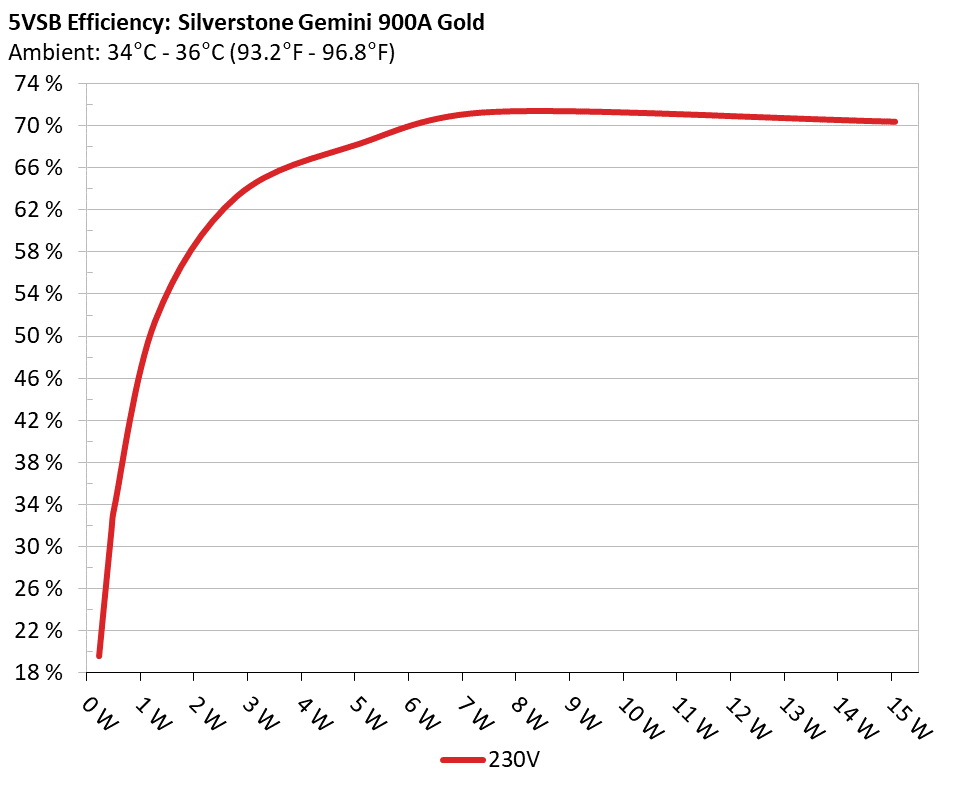
5VSB Efficiency
INFO
This graph depicts the efficiency levels of the 5VSB rail with 115V and 230V input
5VSB Efficiency (ERP LOT 3/6 & CEC) 230V
Test #
5VSB
DC/AC (Watts)
Efficiency
PF/AC Volts
1
0.045A
0.23W
19.542%
0.033
5.123V
1.177W
229.9V
2
0.09A
0.46W
31.498%
0.041
5.117V
1.461W
229.89V
3
0.55A
2.799W
63.247%
0.12
5.092V
4.426W
229.91V
4
1A
5.076W
68.239%
0.187
5.077V
7.439W
229.9V
5
1.5A
7.597W
71.289%
0.228
5.065V
10.656W
229.9V
6
2.999A
15.071W
70.346%
0.345
5.026V
21.424W
229.9V
Supplementary Tests (For Reference)
Typical Load Tests 230V
Test
Main Rail
Standby Rail
DC/AC (Watts)
Efficiency
Temps (In/Out)
PF/AC Volts
10%
7.146A
0.986A
92.973
87.028%
44.45°C
0.857
12.313V
5.069V
106.833
40.2°C
229.89V
20%
14.636A
1.187A
185.967
90.856%
44.84°C
0.934
12.296V
5.054V
204.688
40.34°C
229.88V
30%
22.157A
1.389A
278.969
91.788%
45.36°C
0.96
12.275V
5.04V
303.931
40.54°C
229.87V
40%
29.685A
1.591A
371.71
91.919%
46.62°C
0.972
12.253V
5.028V
404.386
41.42°C
229.85V
50%
37.320A
1.796A
464.725
91.478%
47.71°C
0.981
12.211V
5.009V
508.026
42.18°C
229.84V
60%
44.951A
1.999A
557.747
91.303%
48.44°C
0.985
12.186V
5.003V
610.861
42.27°C
229.83V
70%
52.588A
2.203A
650.76
90.754%
49.93°C
0.988
12.166V
4.989V
717.049
42.9°C
229.82V
80%
60.268A
2.308A
743.288
90.162%
51.21°C
0.989
12.142V
4.979V
824.379
43.12°C
229.81V
90%
68.102A
2.415A
836.557
89.712%
53.3°C
0.991
12.108V
4.966V
932.478
44.21°C
229.79V
100%
75.806A
3.036A
929.179
89.263%
55.12°C
0.991
12.060V
4.938V
1040.943
45.1°C
229.78V
110%
84.083A
3.04A
1022.794
88.727%
57.49°C
0.992
11.986V
4.931V
1152.756
46.59°C
229.76V
The results above are not used in the certification process
Light Load Tests 230V
Test
Main Rail
Standby Rail
DC/AC (Watts)
Efficiency
Temps (In/Out)
PF/AC Volts
20W
1.540A
0.196A
19.991
48.247%
39.87°C
0.418
12.327V
5.11V
30.077
36.81°C
229.9V
40W
3.124A
0.294A
39.993
78.4%
40.54°C
0.687
12.323V
5.101V
51.012
37.2°C
229.89V
60W
4.707A
0.392A
59.989
83.586%
41.71°C
0.777
12.320V
5.095V
71.769
38.24°C
229.89V
80W
6.287A
0.491A
79.92
86.377%
43.01°C
0.831
12.314V
5.09V
92.534
39.27°C
229.89V
The results above are not used in the certification process
Ripple Measurements 230V
Test
12V
5VSB
Pass/Fail
10% Load
73.46mV
29.90mV
Pass
20% Load
80.60mV
31.83mV
Pass
30% Load
83.79mV
37.44mV
Pass
40% Load
75.89mV
33.85mV
Pass
50% Load
89.36mV
40.94mV
Pass
60% Load
97.72mV
42.30mV
Pass
70% Load
104.25mV
37.75mV
Pass
80% Load
117.51mV
33.34mV
Pass
90% Load
141.20mV
42.97mV
Fail
100% Load
156.60mV
43.74mV
Fail
110% Load
168.30mV
11.19mV
Fail
The results above are not used in the certification process
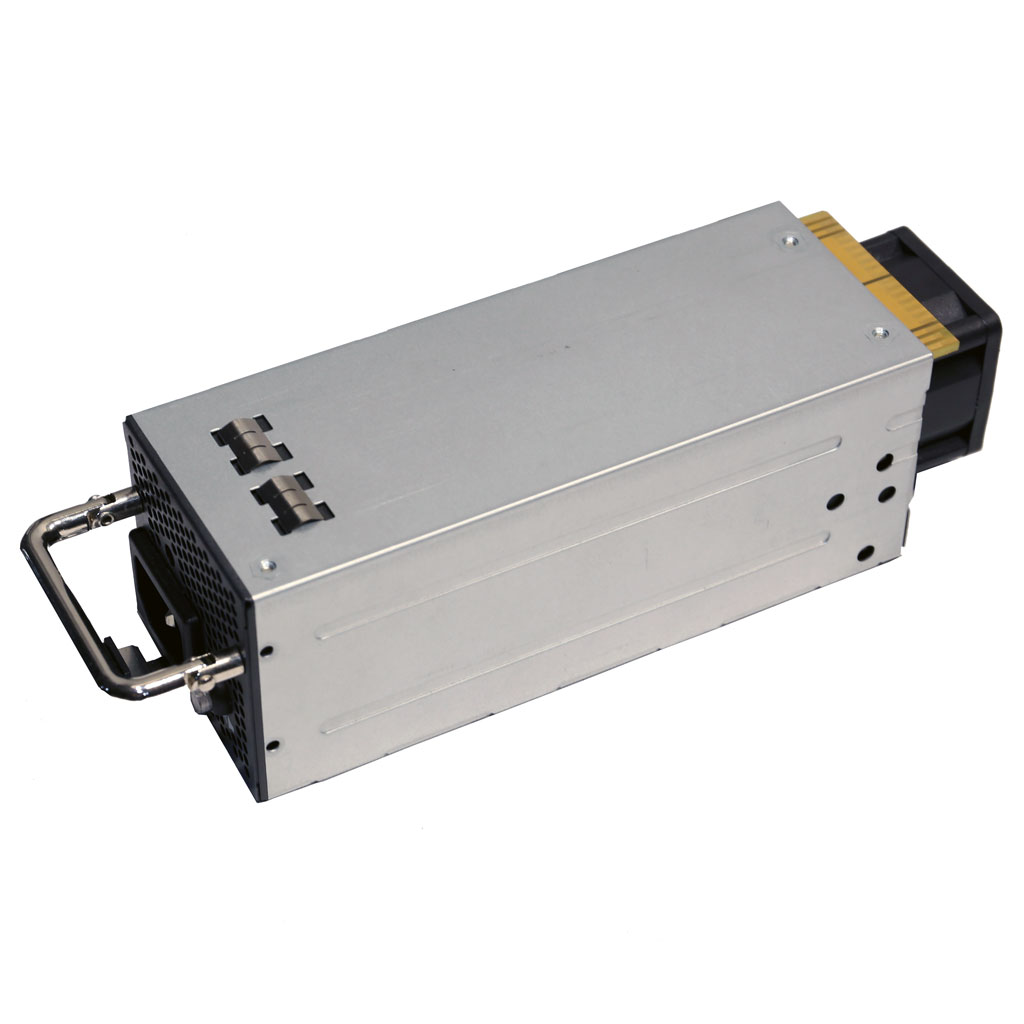
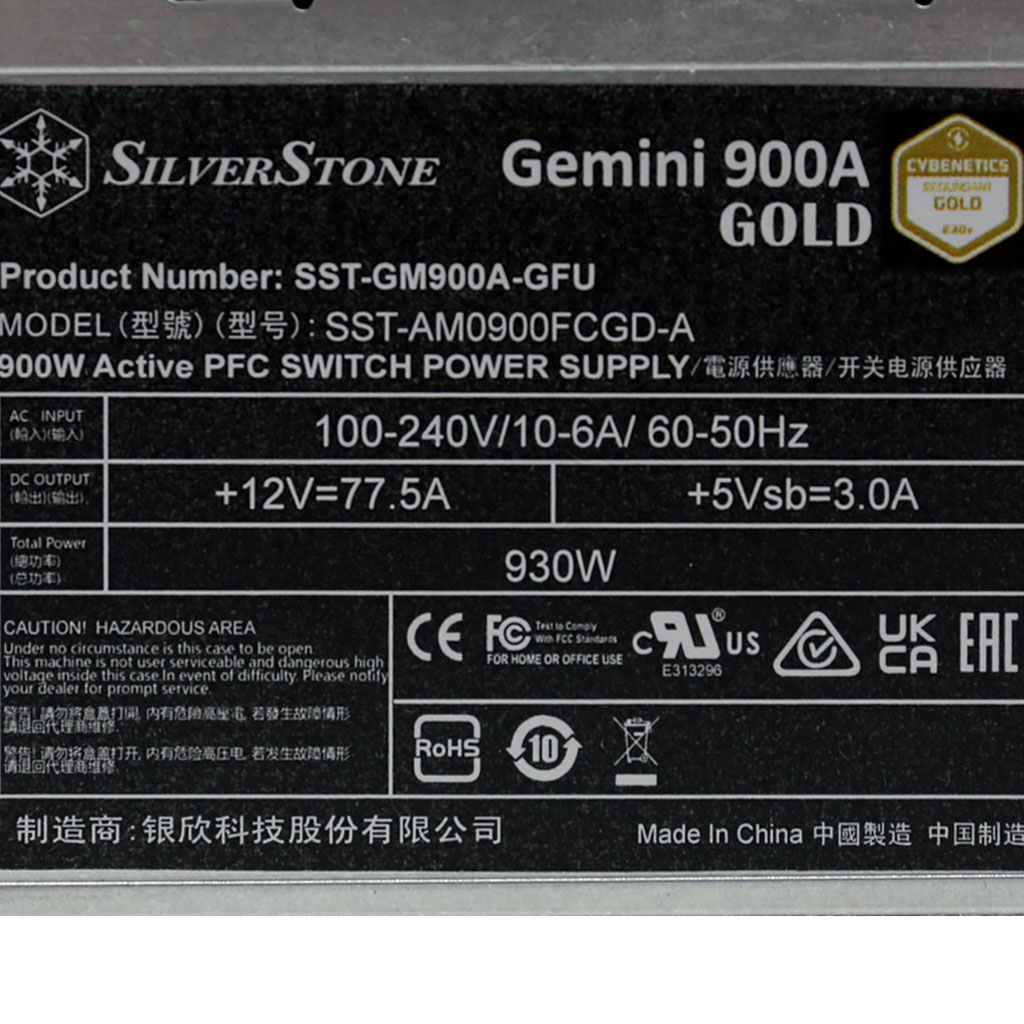
SilverStone Gemini 900A Gold
Top side
Power specifications label
All data and graphs included in this test report can be used by any individual on the following conditions: › It should be mentioned that the test results are provided by Cybenetics › The link to the original test results document should be provided in any case
Cybenetics offers the ETA and Lambda voluntary certification programs, through which the efficient and silent power supplies are promoted