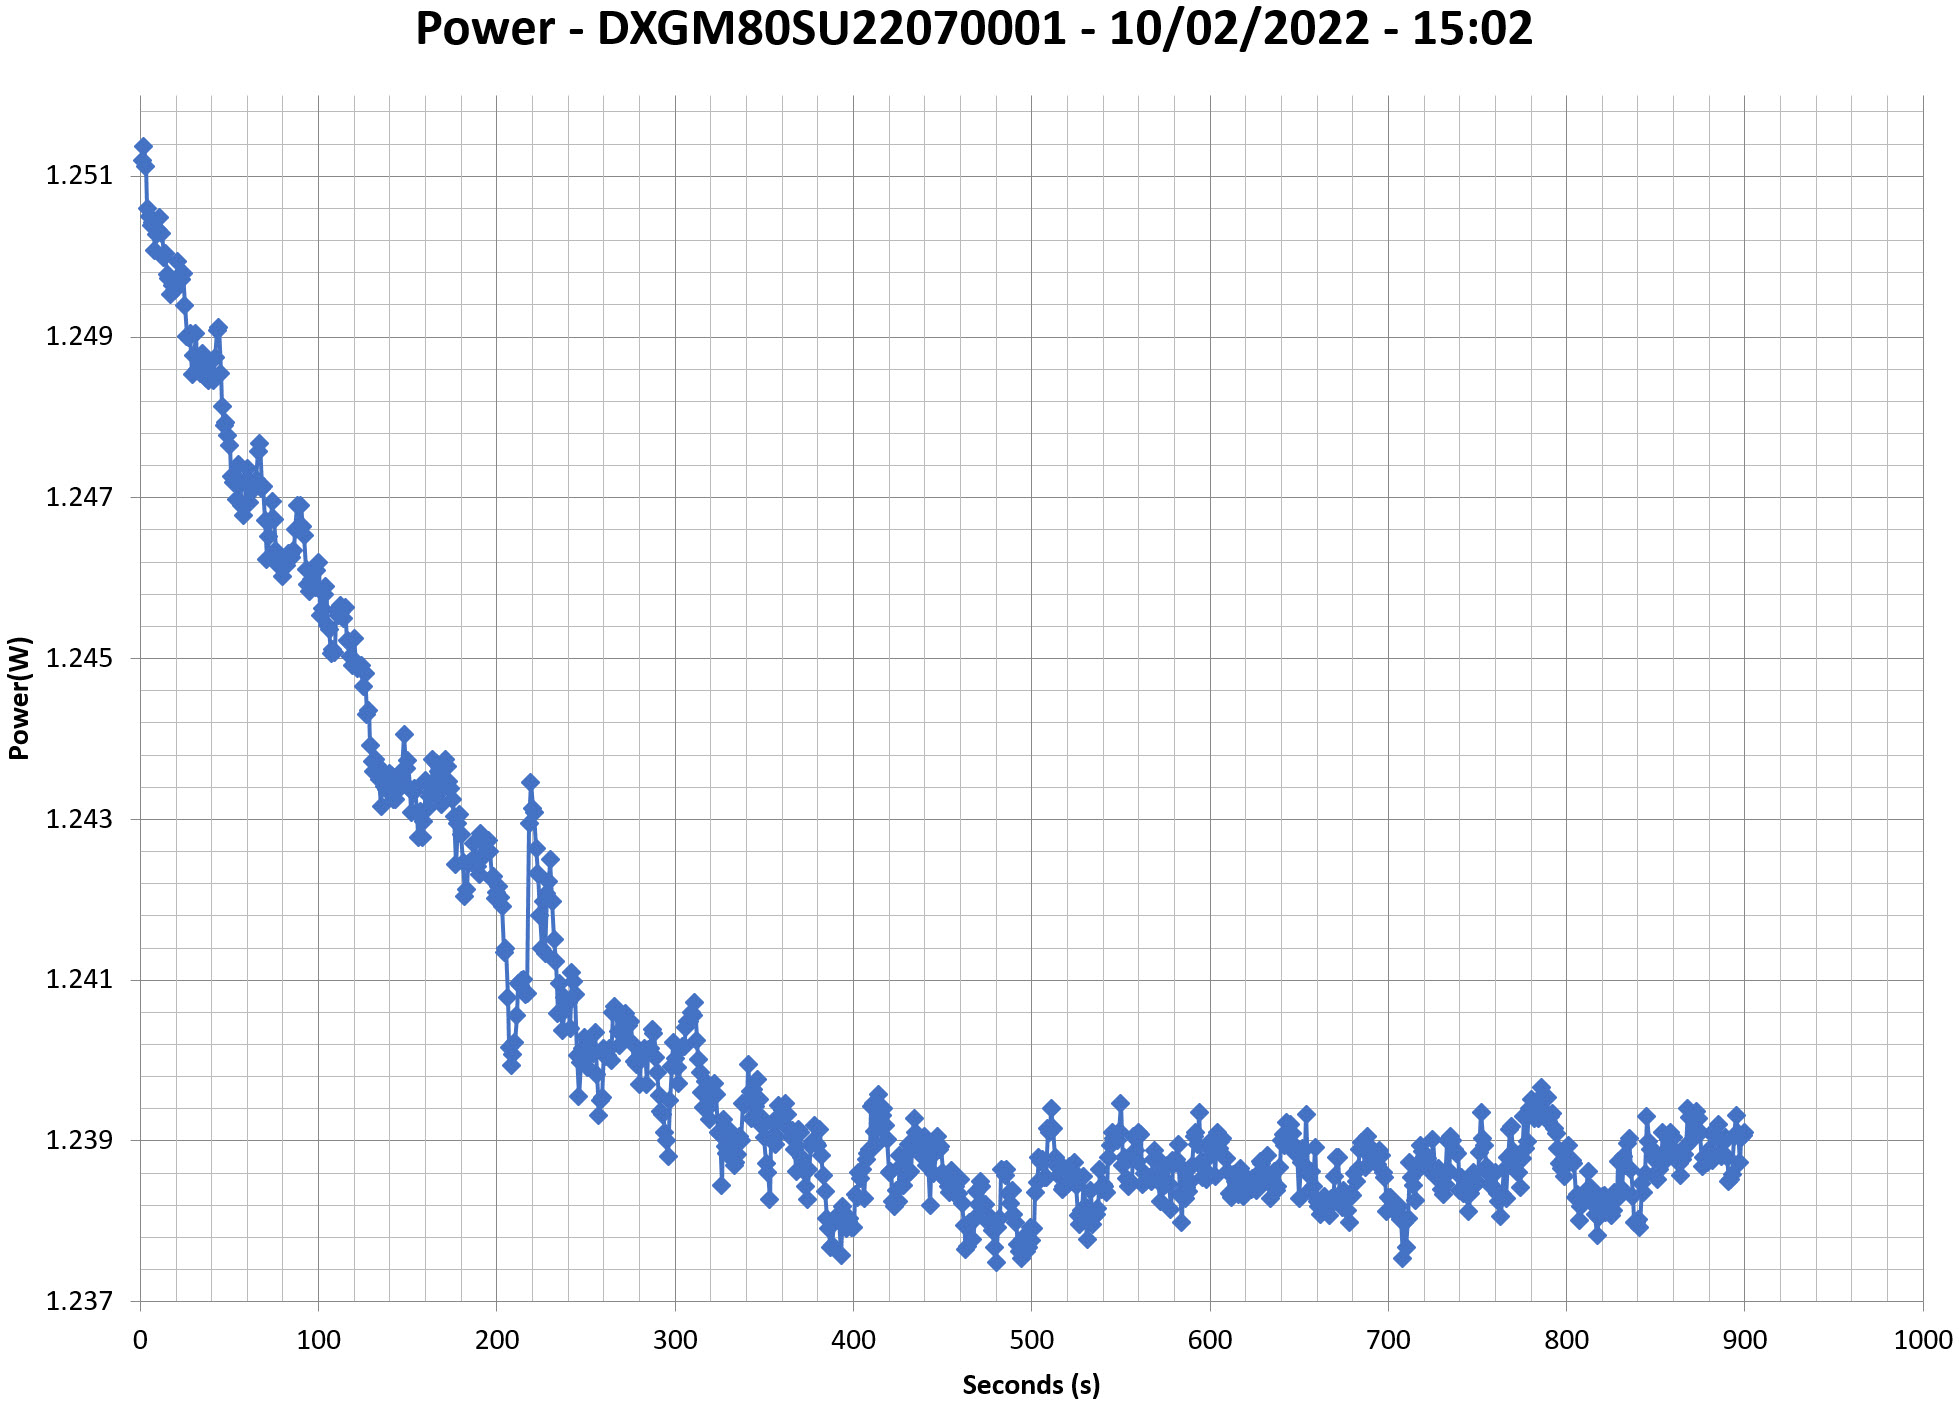
This graph is generated by the PPA Standby Power Analysis software which takes full control of the power analyzer during the whole procedure. This application features all of the EN50564 & IEC62301 test limits for standby power software testing
Efficiency Graph
230V
INFO
This graph depicts the PSU`s efficiency throughout its entire operational range. For the generation of the efficiency and noise graphs we set our loaders to auto mode through our custom-made software before trying thousands of possible load combinations
Noise Graph
230V
Indicative Performance
Efficiency under high ambient temperature
INFO
The PSU`s efficiency under high ambient temperatures with 115V and 230V input. For this graph the results of the 10-110% load regulation table are used
5VSB Efficiency
INFO
This graph depicts the efficiency levels of the 5VSB rail with 115V and 230V input
5VSB Efficiency (ERP LOT 3/6 & CEC) 230V
Test #
5VSB
DC/AC (Watts)
Efficiency
PF/AC Volts
1
0.045A
0.235W
14.988%
0.049
5.231V
1.568W
230.32V
2
0.09A
0.47W
24.985%
0.058
5.224V
1.881W
230.34V
3
0.55A
2.811W
57.301%
0.14
5.112V
4.905W
230.29V
4
1A
5.055W
64.794%
0.201
5.055V
7.801W
230.28V
5
1.5A
7.531W
68.111%
0.253
5.021V
11.056W
230.27V
6
3.499A
17.1W
70.898%
0.361
4.887V
24.119W
230.26V
Supplementary Tests (For Reference)
Typical Load Tests 230V
Test
Main Rail
Standby Rail
DC/AC (Watts)
Efficiency
Temps (In/Out)
PF/AC Volts
10%
6.220A
0.984A
79.935
81.43%
40.18°C
0.816
12.048V
5.081V
98.165
44.97°C
230.31V
20%
12.798A
1.187A
159.966
87.69%
40.67°C
0.865
12.030V
5.053V
182.421
45.8°C
230.3V
30%
19.380A
1.392A
239.928
89.374%
40.77°C
0.91
12.019V
5.027V
268.453
46.38°C
230.28V
40%
25.987A
1.6A
319.971
89.79%
41.3°C
0.943
12.005V
5V
356.357
47.31°C
230.28V
50%
32.541A
1.809A
399.145
89.607%
42.55°C
0.958
11.989V
4.973V
445.44
49.24°C
230.27V
60%
39.194A
2A
479.257
89.134%
43.13°C
0.969
11.975V
4.948V
537.682
50.27°C
230.27V
70%
45.866A
2.234A
559.586
88.465%
43.43°C
0.972
11.961V
4.92V
632.555
51.18°C
230.27V
80%
52.558A
2.345A
639.333
87.624%
43.71°C
0.975
11.945V
4.901V
729.633
51.97°C
230.27V
90%
59.334A
2.457A
719.867
86.567%
44.71°C
0.976
11.930V
4.882V
831.576
53.8°C
230.27V
100%
65.662A
3.665A
799.782
85.336%
45.3°C
0.977
11.914V
4.774V
937.219
55.1°C
230.27V
110%
72.476A
3.675A
879.778
83.944%
46.07°C
0.976
11.898V
4.76V
1048.063
56.77°C
230.27V
The results above are not used in the certification process
Light Load Tests 230V
Test
Main Rail
Standby Rail
DC/AC (Watts)
Efficiency
Temps (In/Out)
PF/AC Volts
20W
1.575A
0.193A
19.991
56.488%
36.36°C
0.6
12.056V
5.181V
35.389
39.54°C
230.32V
40W
3.194A
0.291A
39.995
71.497%
37.18°C
0.718
12.053V
5.161V
55.94
40.62°C
230.32V
60W
4.812A
0.389A
59.992
78.33%
37.78°C
0.783
12.051V
5.145V
76.589
41.64°C
230.33V
80W
6.426A
0.487A
79.932
81.909%
38.35°C
0.814
12.049V
5.132V
97.587
42.61°C
230.33V
The results above are not used in the certification process
Ripple Measurements 230V
Test
Main Rail
Standby Rail
Pass/Fail
10% Load
10.9 mV
8.8 mV
Pass
20% Load
12.2 mV
9.1 mV
Pass
30% Load
14.0 mV
8.2 mV
Pass
40% Load
17.2 mV
9.0 mV
Pass
50% Load
23.3 mV
9.1 mV
Pass
60% Load
28.0 mV
10.8 mV
Pass
70% Load
34.6 mV
10.4 mV
Pass
80% Load
39.6 mV
11.3 mV
Pass
90% Load
46.4 mV
12.1 mV
Pass
100% Load
54.9 mV
17.1 mV
Pass
110% Load
60.4 mV
16.2 mV
Pass
The results above are not used in the certification process
SilverStone GM800 Silver
Top side
Power specifications label
All data and graphs included in this test report can be used by any individual on the following conditions: › It should be mentioned that the test results are provided by Cybenetics › The link to the original test results document should be provided in any case
Cybenetics offers the ETA and Lambda voluntary certification programs, through which the efficient and silent power supplies are promoted