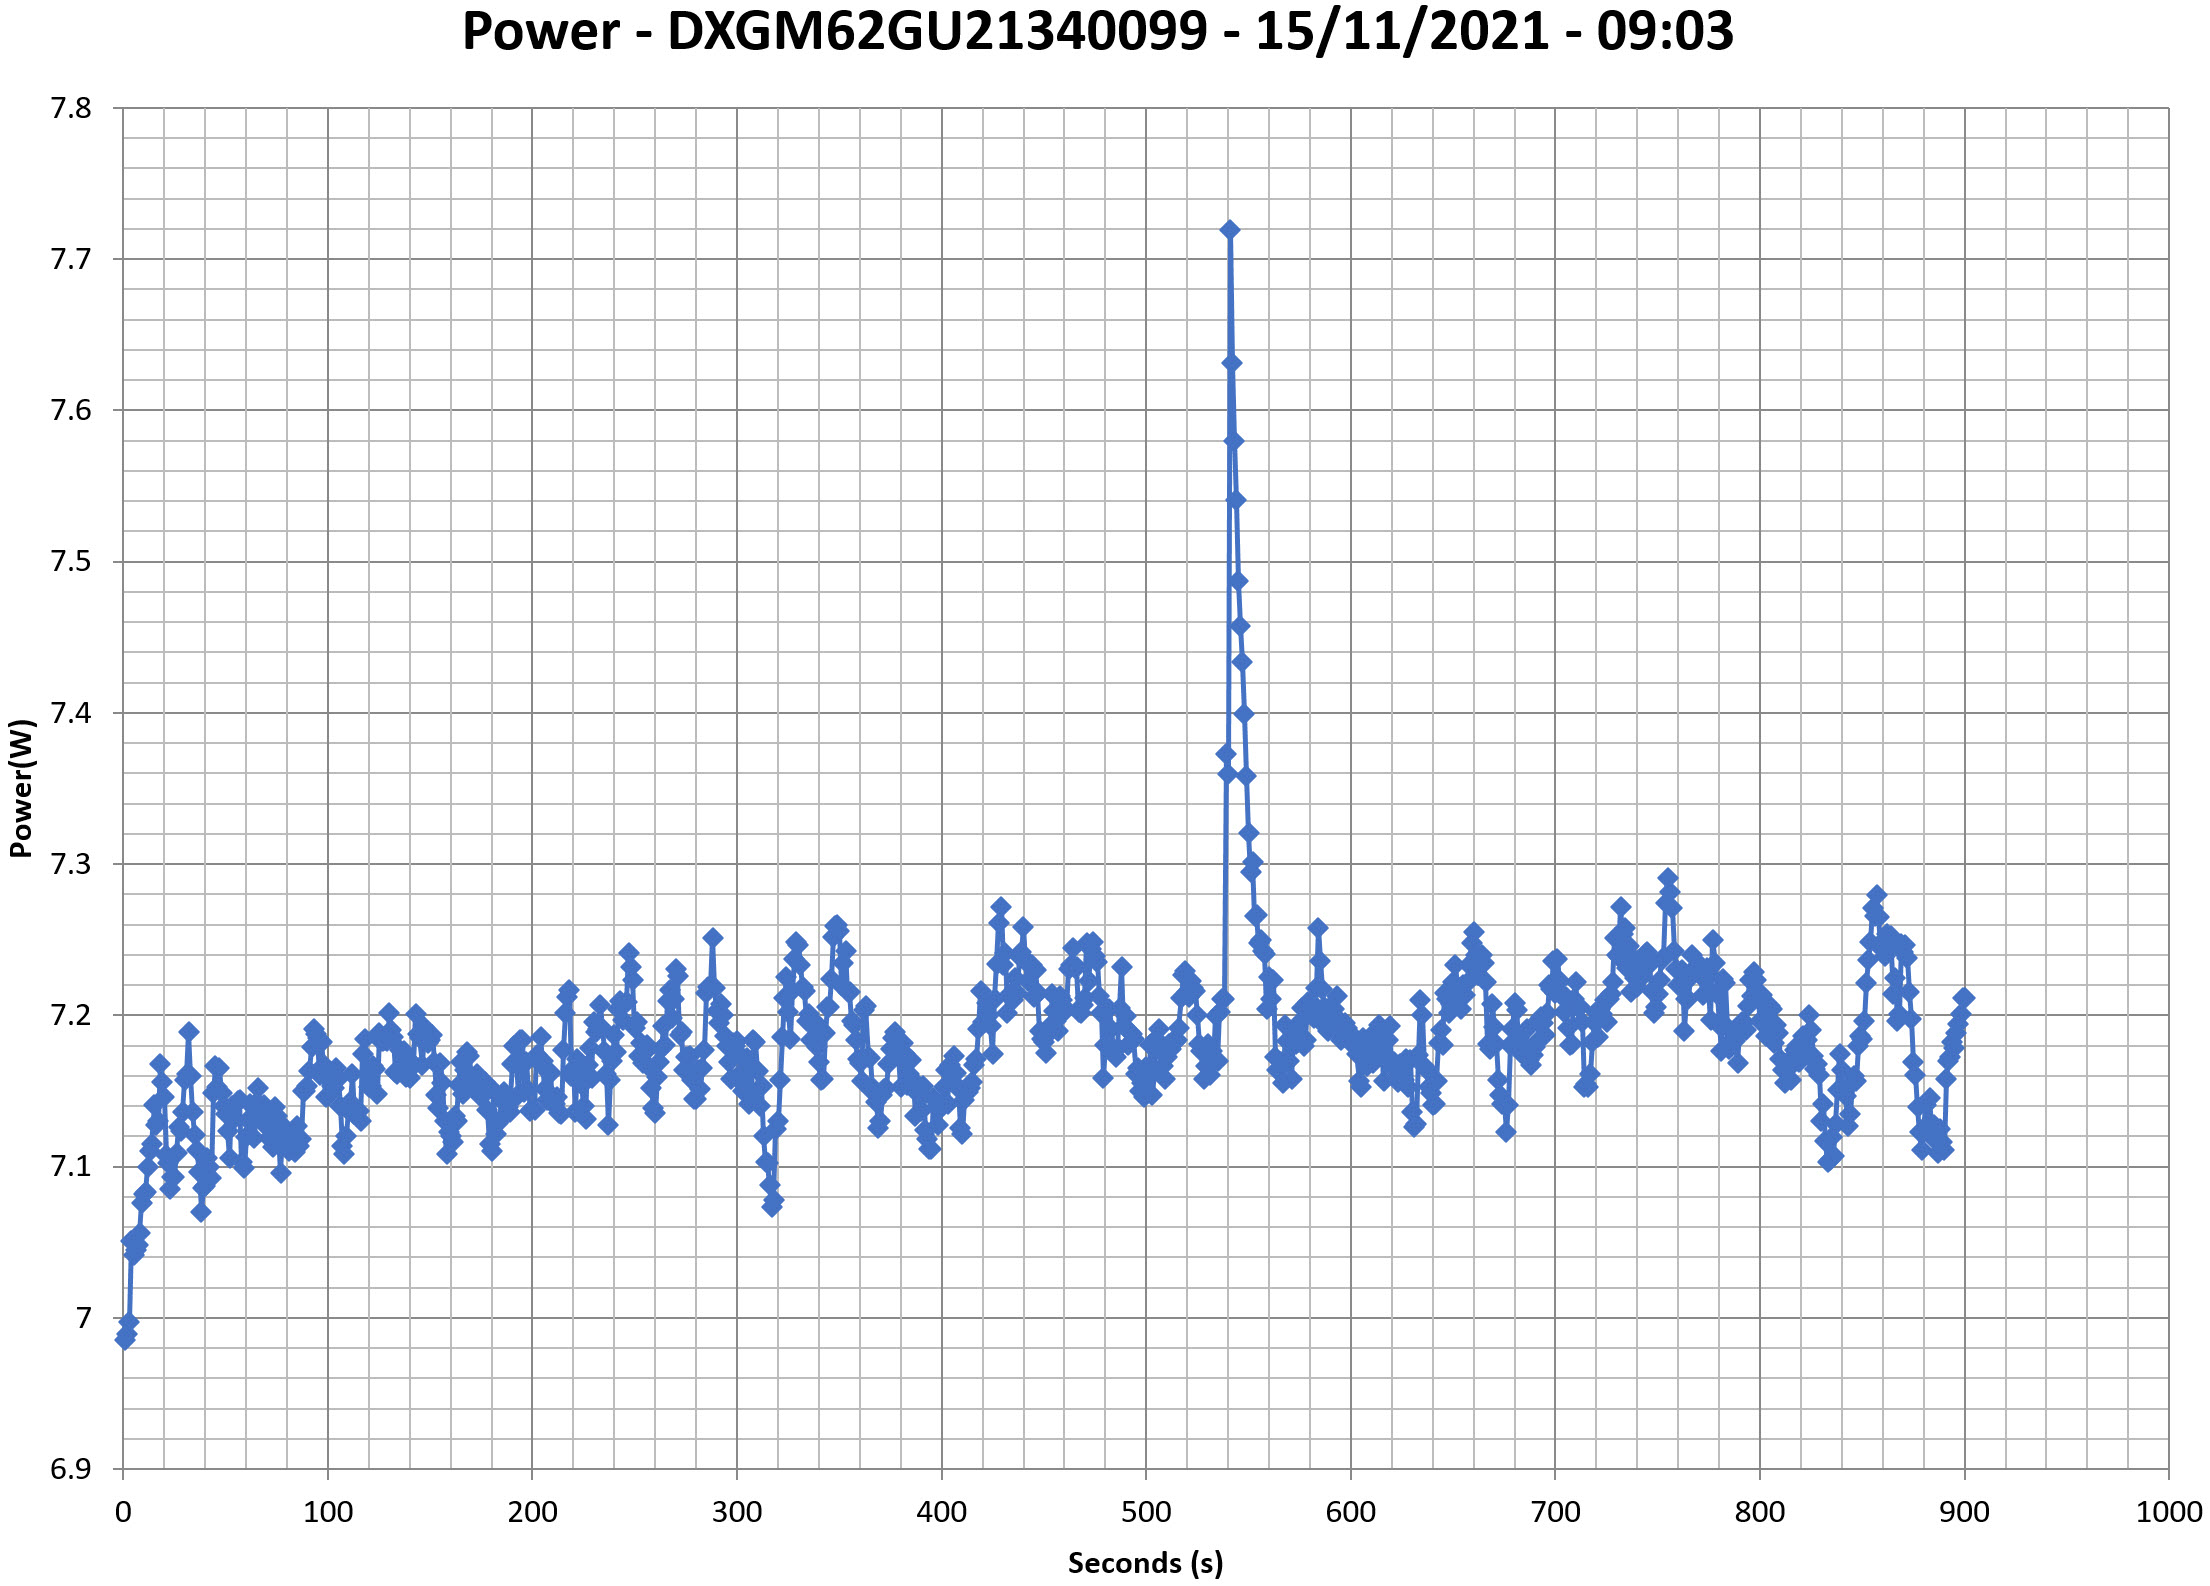
This graph is generated by the PPA Standby Power Analysis software which takes full control of the power analyzer during the whole procedure. This application features all of the EN50564 & IEC62301 test limits for standby power software testing
Efficiency Graph
230V
INFO
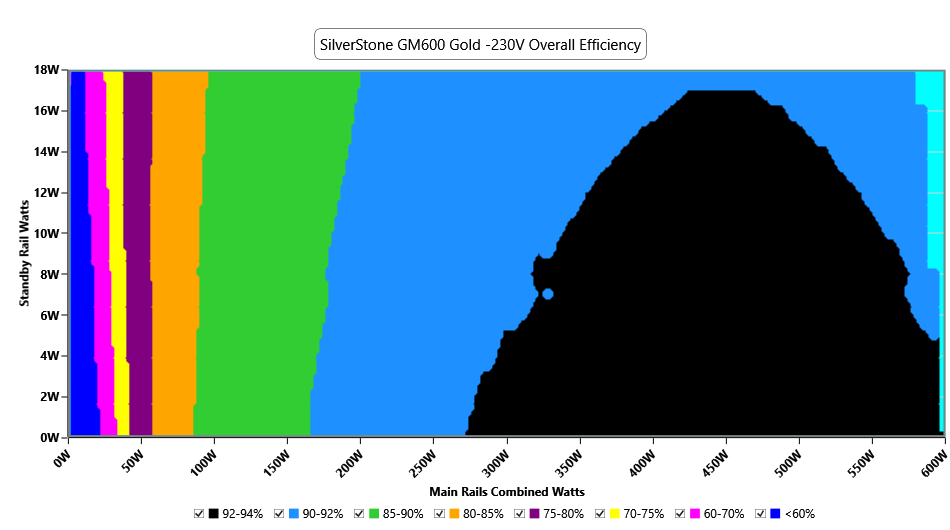
This graph depicts the PSU`s efficiency throughout its entire operational range. For the generation of the efficiency and noise graphs we set our loaders to auto mode through our custom-made software before trying thousands of possible load combinations
Noise Graph
230V
Indicative Performance
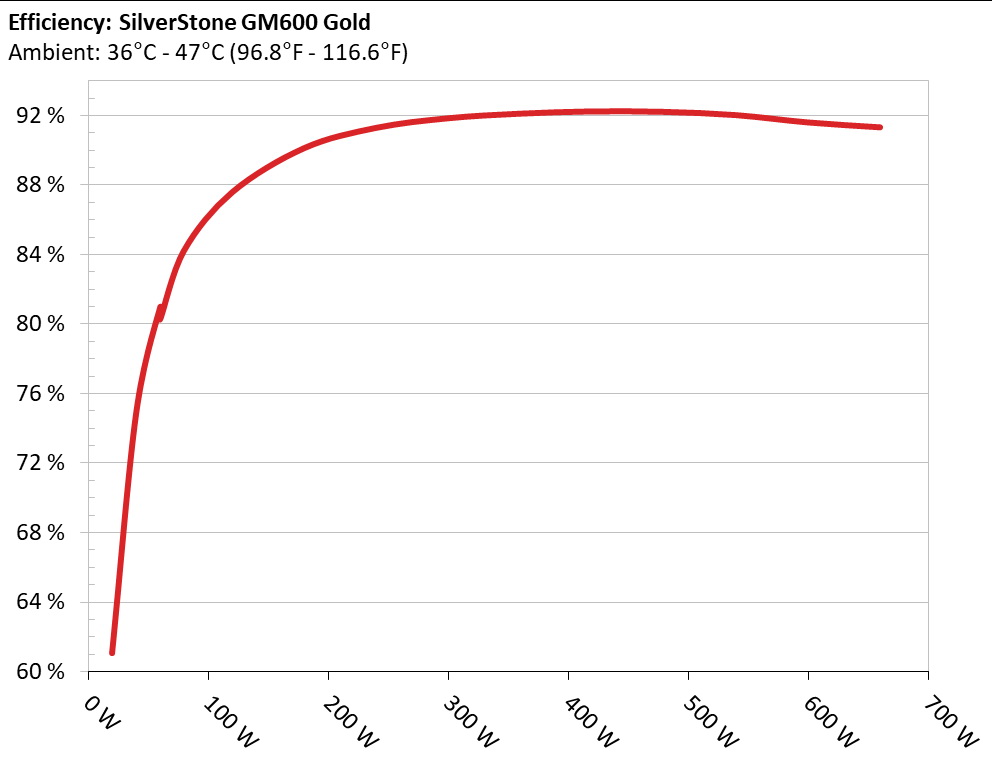
Efficiency under high ambient temperature
INFO
The PSU`s efficiency under high ambient temperatures with 115V and 230V input. For this graph the results of the 10-110% load regulation table are used
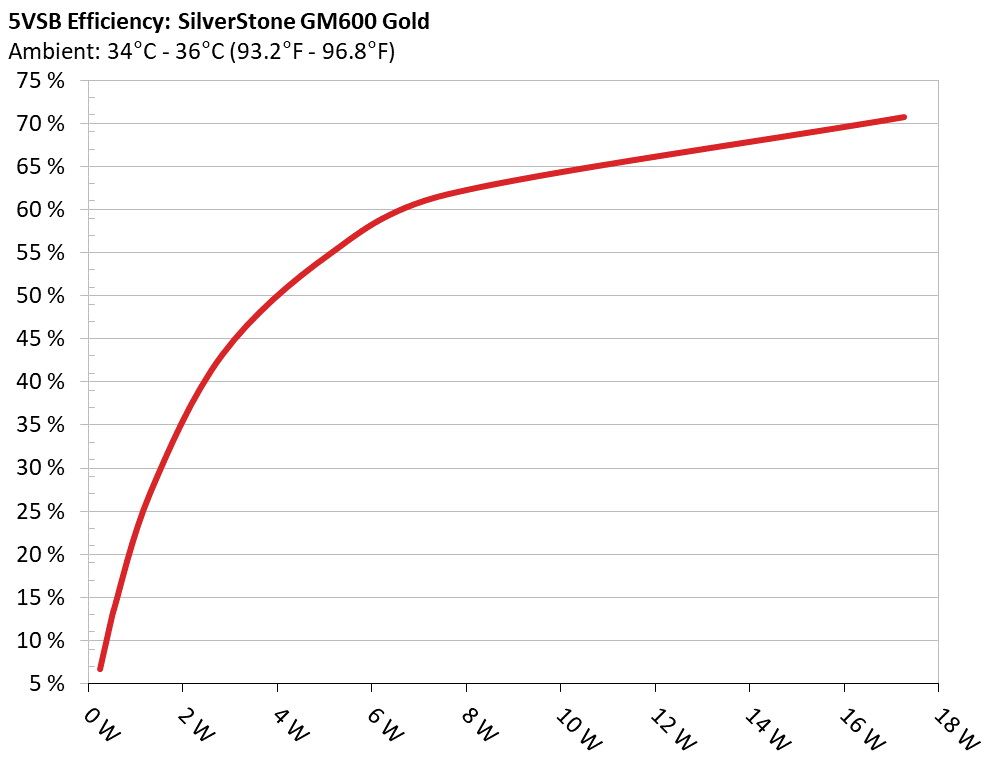
5VSB Efficiency
INFO
This graph depicts the efficiency levels of the 5VSB rail with 115V and 230V input
5VSB Efficiency (ERP LOT 3/6 & CEC) 230V
Test #
5VSB
DC/AC (Watts)
Efficiency
PF/AC Volts
1
0.045A
0.235W
6.683%
0.086
5.22V
3.516W
230.27V
2
0.09A
0.468W
12.348%
0.092
5.201V
3.79W
230.27V
3
0.55A
2.822W
43.167%
0.143
5.133V
6.538W
230.28V
4
1A
5.097W
54.852%
0.182
5.098V
9.293W
230.28V
5
1.5A
7.608W
61.806%
0.213
5.073V
12.31W
230.28V
6
3.499A
17.254W
70.739%
0.276
4.931V
24.392W
230.28V
Supplementary Tests (For Reference)
Typical Load Tests 230V
Test
Main Rail
Standby Rail
DC/AC (Watts)
Efficiency
Temps (In/Out)
PF/AC Volts
10%
4.544A
0.986A
59.992
80.266%
38.58°C
0.817
12.101V
5.071V
74.742
42.13°C
230.27V
20%
9.430A
1.182A
119.976
87.568%
39.3°C
0.897
12.087V
5.073V
137.009
43.21°C
230.27V
30%
14.325A
1.385A
179.937
90.105%
40.24°C
0.933
12.072V
5.054V
199.697
44.42°C
230.27V
40%
19.236A
1.589A
239.975
91.276%
40.69°C
0.947
12.059V
5.034V
262.91
45.25°C
230.27V
50%
24.153A
1.794A
299.94
91.828%
41.29°C
0.958
12.045V
5.015V
326.631
46.31°C
230.29V
60%
29.053A
2A
359.433
92.089%
42.04°C
0.967
12.028V
4.996V
390.312
47.64°C
230.29V
70%
34.007A
2.208A
419.583
92.219%
43.05°C
0.972
12.015V
4.978V
454.986
49.27°C
230.3V
80%
38.999A
2.314A
479.332
92.194%
43.65°C
0.975
11.996V
4.968V
519.919
50.47°C
230.29V
90%
44.073A
2.419A
539.871
92.007%
44.65°C
0.978
11.977V
4.958V
586.774
52.33°C
230.29V
100%
48.712A
3.592A
599.78
91.587%
45.95°C
0.98
11.953V
4.871V
654.875
54.54°C
230.29V
110%
53.860A
3.597A
659.83
91.307%
46.76°C
0.983
11.926V
4.864V
722.652
56.2°C
230.29V
The results above are not used in the certification process
Light Load Tests 230V
Test
Main Rail
Standby Rail
DC/AC (Watts)
Efficiency
Temps (In/Out)
PF/AC Volts
10W
1.568A
0.194A
19.988
61.054%
35.67°C
0.608
12.110V
5.167V
32.739
36.87°C
230.27V
20W
3.180A
0.291A
39.993
74.849%
36.26°C
0.747
12.104V
5.149V
53.432
37.69°C
230.27V
30W
4.793A
0.39A
59.992
80.936%
36.6°C
0.816
12.100V
5.131V
74.122
38.52°C
230.27V
40W
6.400A
0.488A
79.916
84.212%
37.23°C
0.854
12.095V
5.122V
94.898
39.52°C
230.27V
The results above are not used in the certification process
Ripple Measurements 230V
Test
Main Rail
Standby Rail
Pass/Fail
10% Load
32.9 mV
18.5 mV
Pass
20% Load
30.4 mV
29.1 mV
Pass
30% Load
32.6 mV
31.0 mV
Pass
40% Load
39.6 mV
31.0 mV
Pass
50% Load
46.5 mV
33.0 mV
Pass
60% Load
51.9 mV
36.7 mV
Pass
70% Load
71.4 mV
39.0 mV
Pass
80% Load
82.2 mV
42.0 mV
Pass
90% Load
96.3 mV
45.2 mV
Pass
100% Load
145.0 mV
45.7 mV
Fail
110% Load
198.6 mV
47.1 mV
Fail
The results above are not used in the certification process
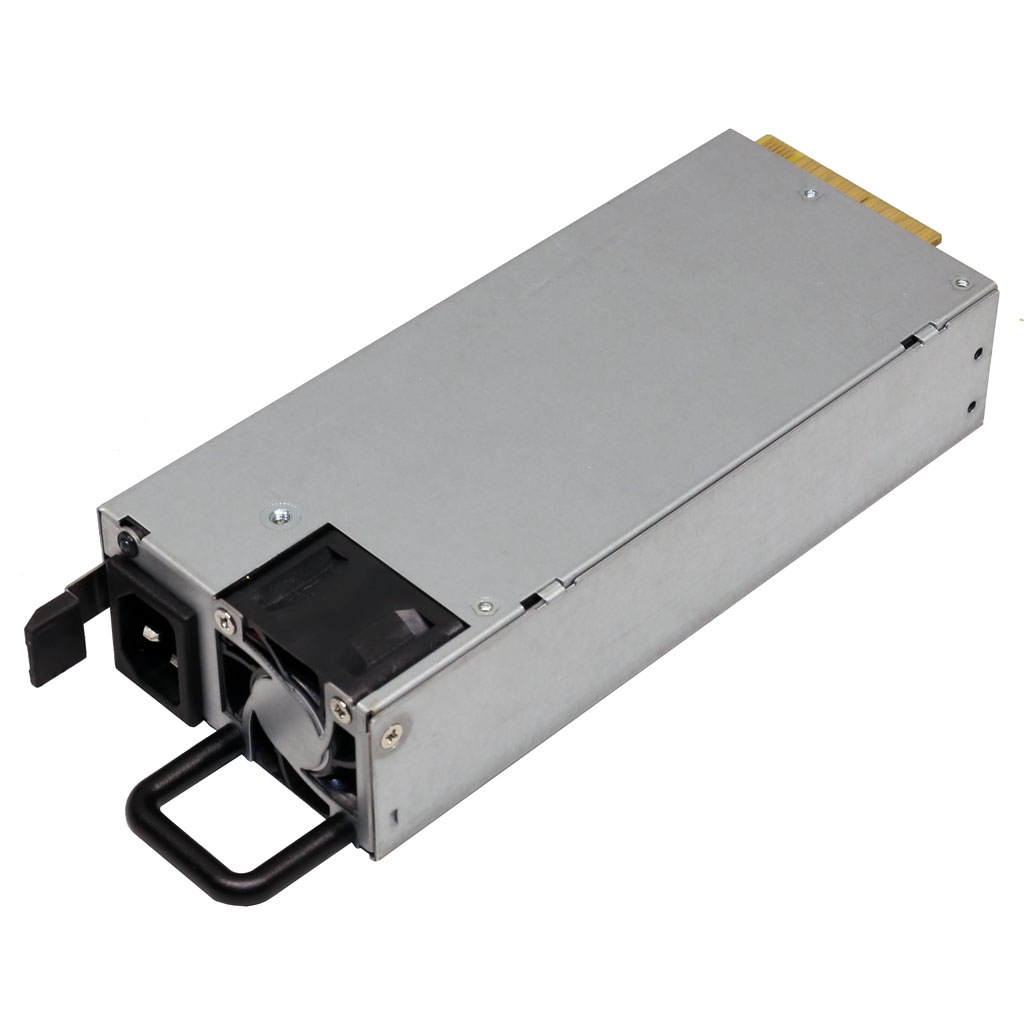
SilverStone GM600 2U Gold
Top side
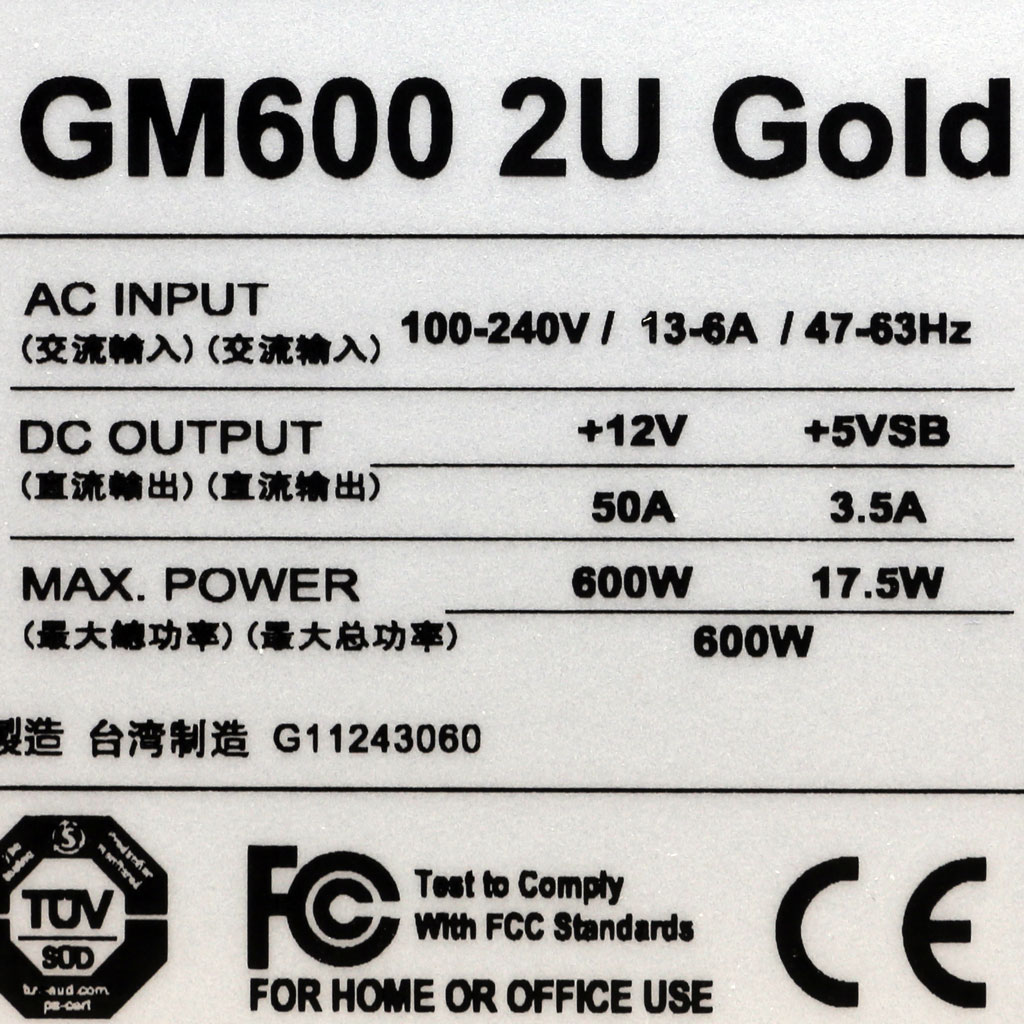
Power specifications label
All data and graphs included in this test report can be used by any individual on the following conditions: › It should be mentioned that the test results are provided by Cybenetics › The link to the original test results document should be provided in any case
Cybenetics offers the ETA and Lambda voluntary certification programs, through which the efficient and silent power supplies are promoted