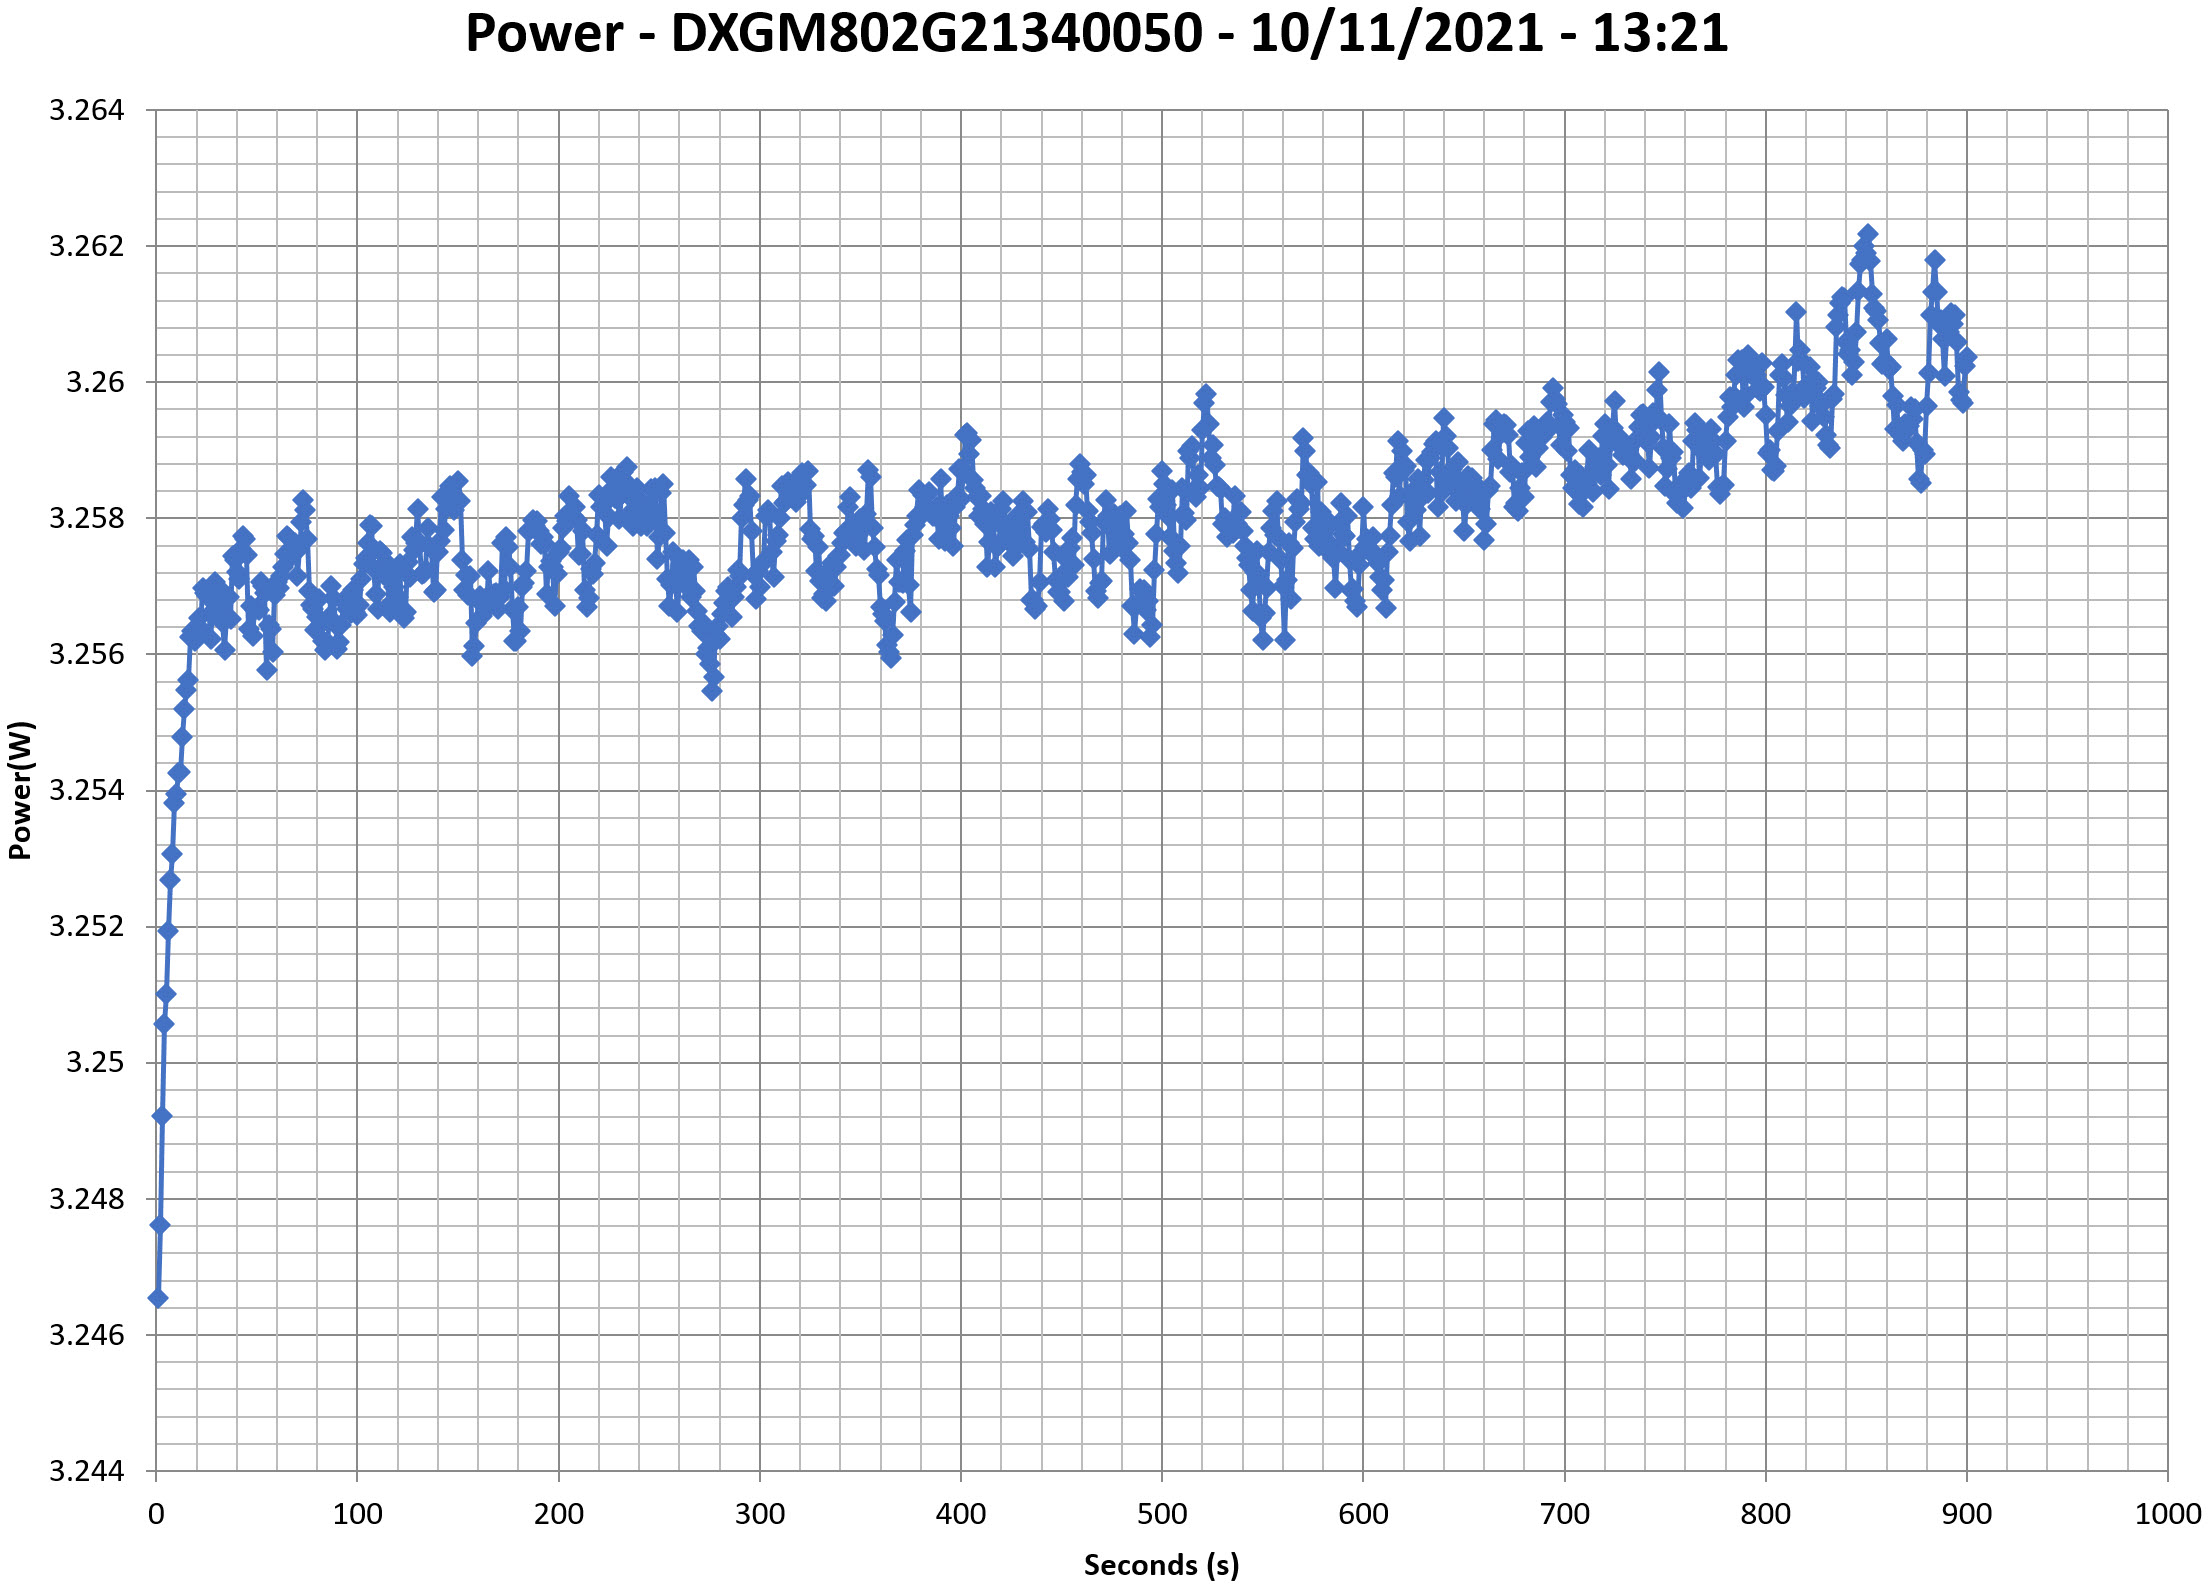
This graph is generated by the PPA Standby Power Analysis software which takes full control of the power analyzer during the whole procedure. This application features all of the EN50564 & IEC62301 test limits for standby power software testing
Efficiency Graph
230V
INFO
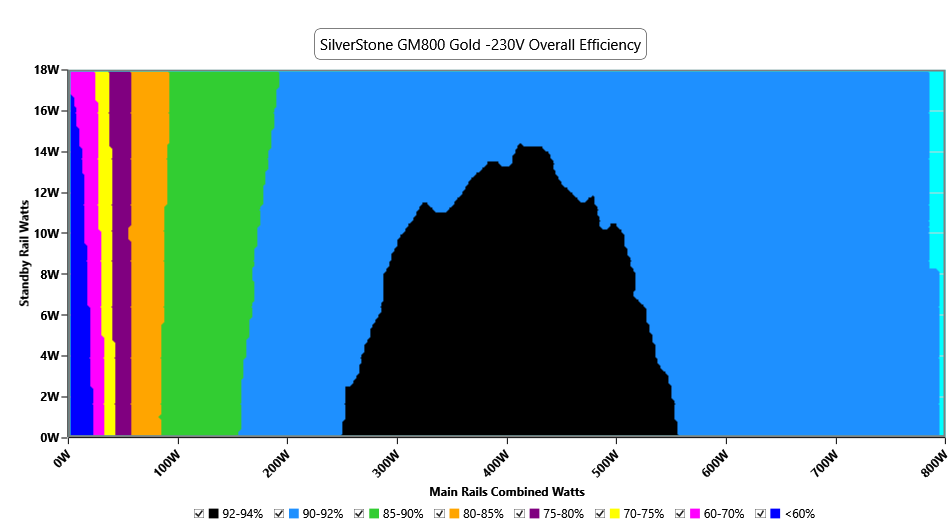
This graph depicts the PSU`s efficiency throughout its entire operational range. For the generation of the efficiency and noise graphs we set our loaders to auto mode through our custom-made software before trying thousands of possible load combinations
Noise Graph
230V
Indicative Performance
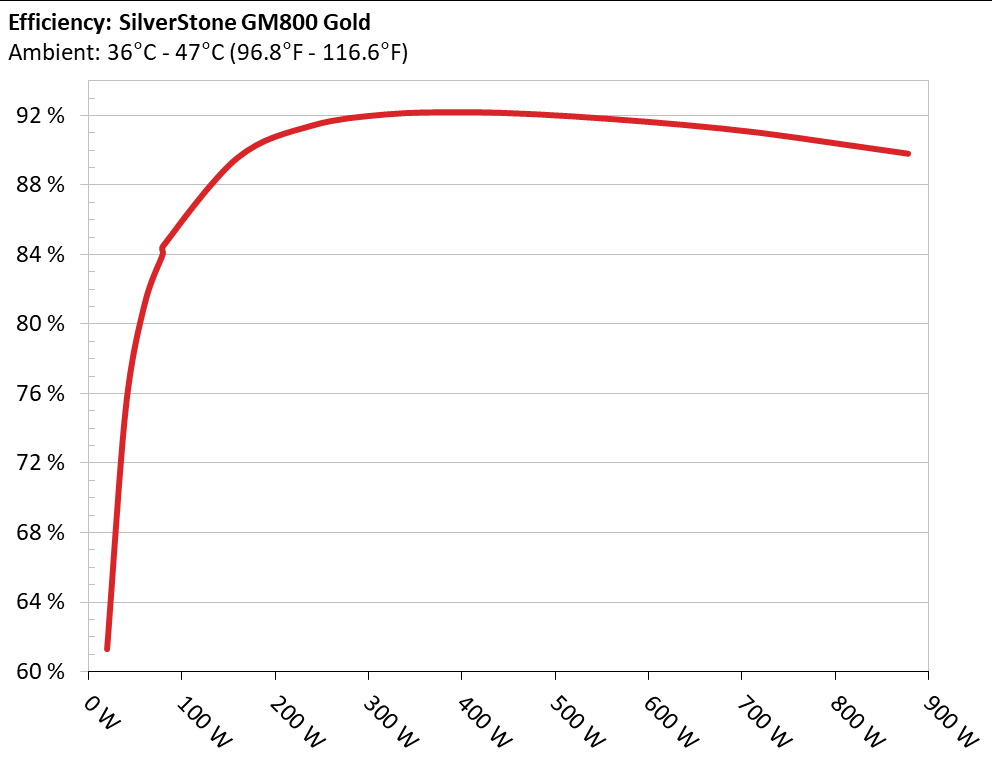
Efficiency under high ambient temperature
INFO
The PSU`s efficiency under high ambient temperatures with 115V and 230V input. For this graph the results of the 10-110% load regulation table are used
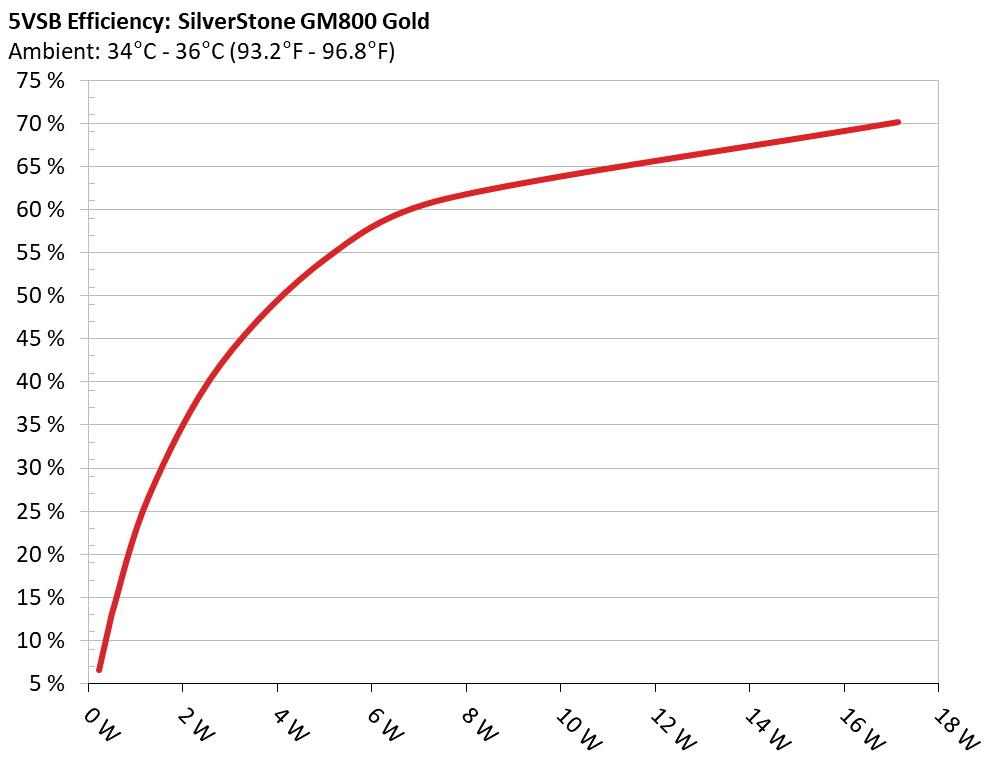
5VSB Efficiency
INFO
This graph depicts the efficiency levels of the 5VSB rail with 115V and 230V input
5VSB Efficiency (ERP LOT 3/6 & CEC) 230V
Test #
5VSB
DC/AC (Watts)
Efficiency
PF/AC Volts
1
0.045A
0.233W
6.602%
0.085
5.193V
3.529W
230.26V
2
0.09A
0.465W
12.228%
0.091
5.172V
3.803W
230.26V
3
0.55A
2.804W
42.043%
0.144
5.101V
6.67W
230.25V
4
1A
5.069W
54.473%
0.181
5.07V
9.306W
230.25V
5
1.5A
7.564W
61.242%
0.212
5.044V
12.352W
230.25V
6
3.499A
17.13W
70.128%
0.276
4.896V
24.427W
230.25V
Supplementary Tests (For Reference)
Typical Load Tests 230V
Test
Main Rail
Standby Rail
DC/AC (Watts)
Efficiency
Temps (In/Out)
PF/AC Volts
10%
6.157A
0.992A
79.777
84.063%
38.46°C
0.847
12.145V
5.04V
94.902
42.28°C
230.28V
20%
12.667A
1.196A
159.572
89.583%
39.28°C
0.908
12.124V
5.018V
178.127
43.73°C
230.27V
30%
19.199A
1.394A
239.376
91.443%
40.45°C
0.933
12.104V
5.02V
261.777
45.24°C
230.27V
40%
25.745A
1.601A
319.182
92.089%
41.76°C
0.947
12.087V
4.997V
346.601
46.85°C
230.27V
50%
32.279A
1.809A
398.388
92.217%
42.27°C
0.958
12.063V
4.975V
432.013
47.67°C
230.27V
60%
38.988A
2A
478.535
92.097%
42.87°C
0.964
12.020V
4.955V
519.6
48.68°C
230.27V
70%
45.704A
2.229A
558.061
91.826%
43.45°C
0.969
11.970V
4.932V
607.738
49.73°C
230.26V
80%
52.572A
2.337A
637.826
91.482%
44.28°C
0.974
11.914V
4.918V
697.218
51.18°C
230.26V
90%
59.519A
2.445A
717.594
91.04%
44.85°C
0.977
11.855V
4.906V
788.217
52.49°C
230.26V
100%
66.125A
3.634A
797.574
90.442%
45.49°C
0.979
11.797V
4.814V
881.864
53.56°C
230.25V
110%
73.312A
3.639A
877.636
89.823%
46.78°C
0.982
11.733V
4.807V
977.075
55.58°C
230.25V
The results above are not used in the certification process
Light Load Tests 230V
Test
Main Rail
Standby Rail
DC/AC (Watts)
Efficiency
Temps (In/Out)
PF/AC Volts
10W
1.562A
0.195A
19.994
61.271%
35.89°C
0.577
12.159V
5.139V
32.632
37.23°C
230.31V
20W
3.167A
0.293A
39.995
75.154%
36.24°C
0.727
12.156V
5.116V
53.217
38.16°C
230.3V
30W
4.773A
0.392A
59.992
81.112%
37.1°C
0.802
12.150V
5.103V
73.962
39.36°C
230.29V
40W
6.374A
0.491A
79.917
84.498%
37.59°C
0.846
12.145V
5.087V
94.579
40.25°C
230.28V
The results above are not used in the certification process
Ripple Measurements 230V
Test
Main Rail
Standby Rail
Pass/Fail
10% Load
24.3 mV
15.0 mV
Pass
20% Load
35.0 mV
17.1 mV
Pass
30% Load
49.3 mV
30.2 mV
Pass
40% Load
66.1 mV
31.9 mV
Pass
50% Load
127.4 mV
36.0 mV
Fail
60% Load
183.5 mV
43.5 mV
Fail
70% Load
200.0 mV
43.1 mV
Fail
80% Load
200.0 mV
45.8 mV
Fail
90% Load
200.0 mV
47.9 mV
Fail
100% Load
599.7 mV
55.9 mV
Fail
110% Load
693.2 mV
57.1 mV
Fail
The results above are not used in the certification process
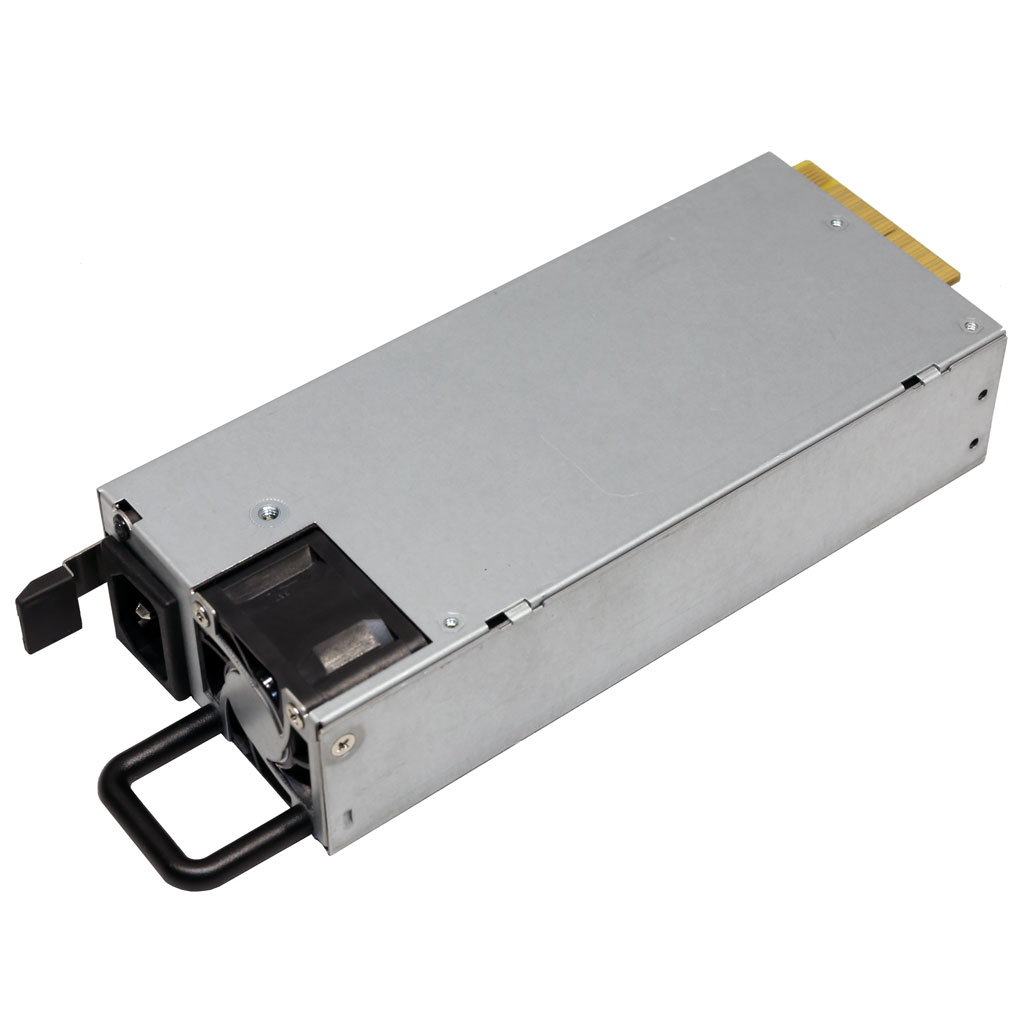
SilverStone GM800 2U Gold
Top side
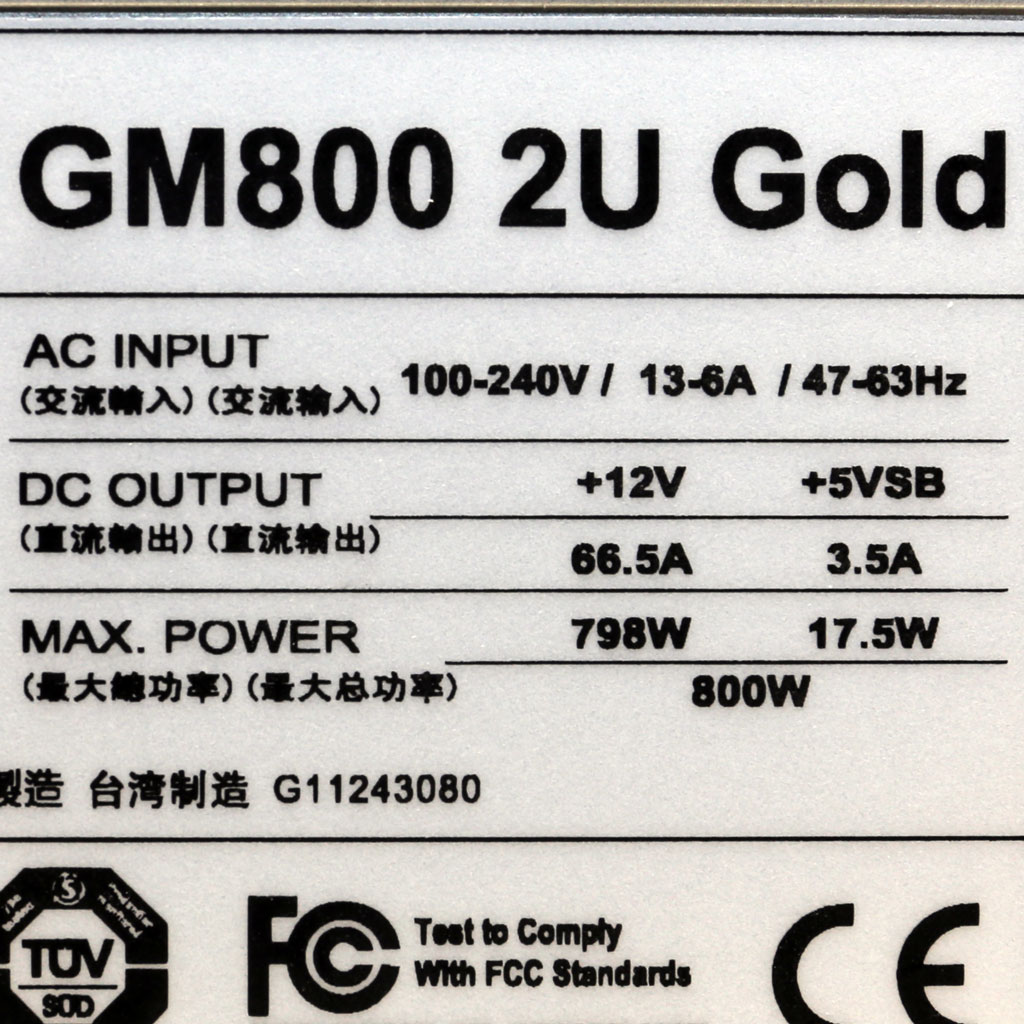
Power specifications label
All data and graphs included in this test report can be used by any individual on the following conditions: › It should be mentioned that the test results are provided by Cybenetics › The link to the original test results document should be provided in any case
Cybenetics offers the ETA and Lambda voluntary certification programs, through which the efficient and silent power supplies are promoted