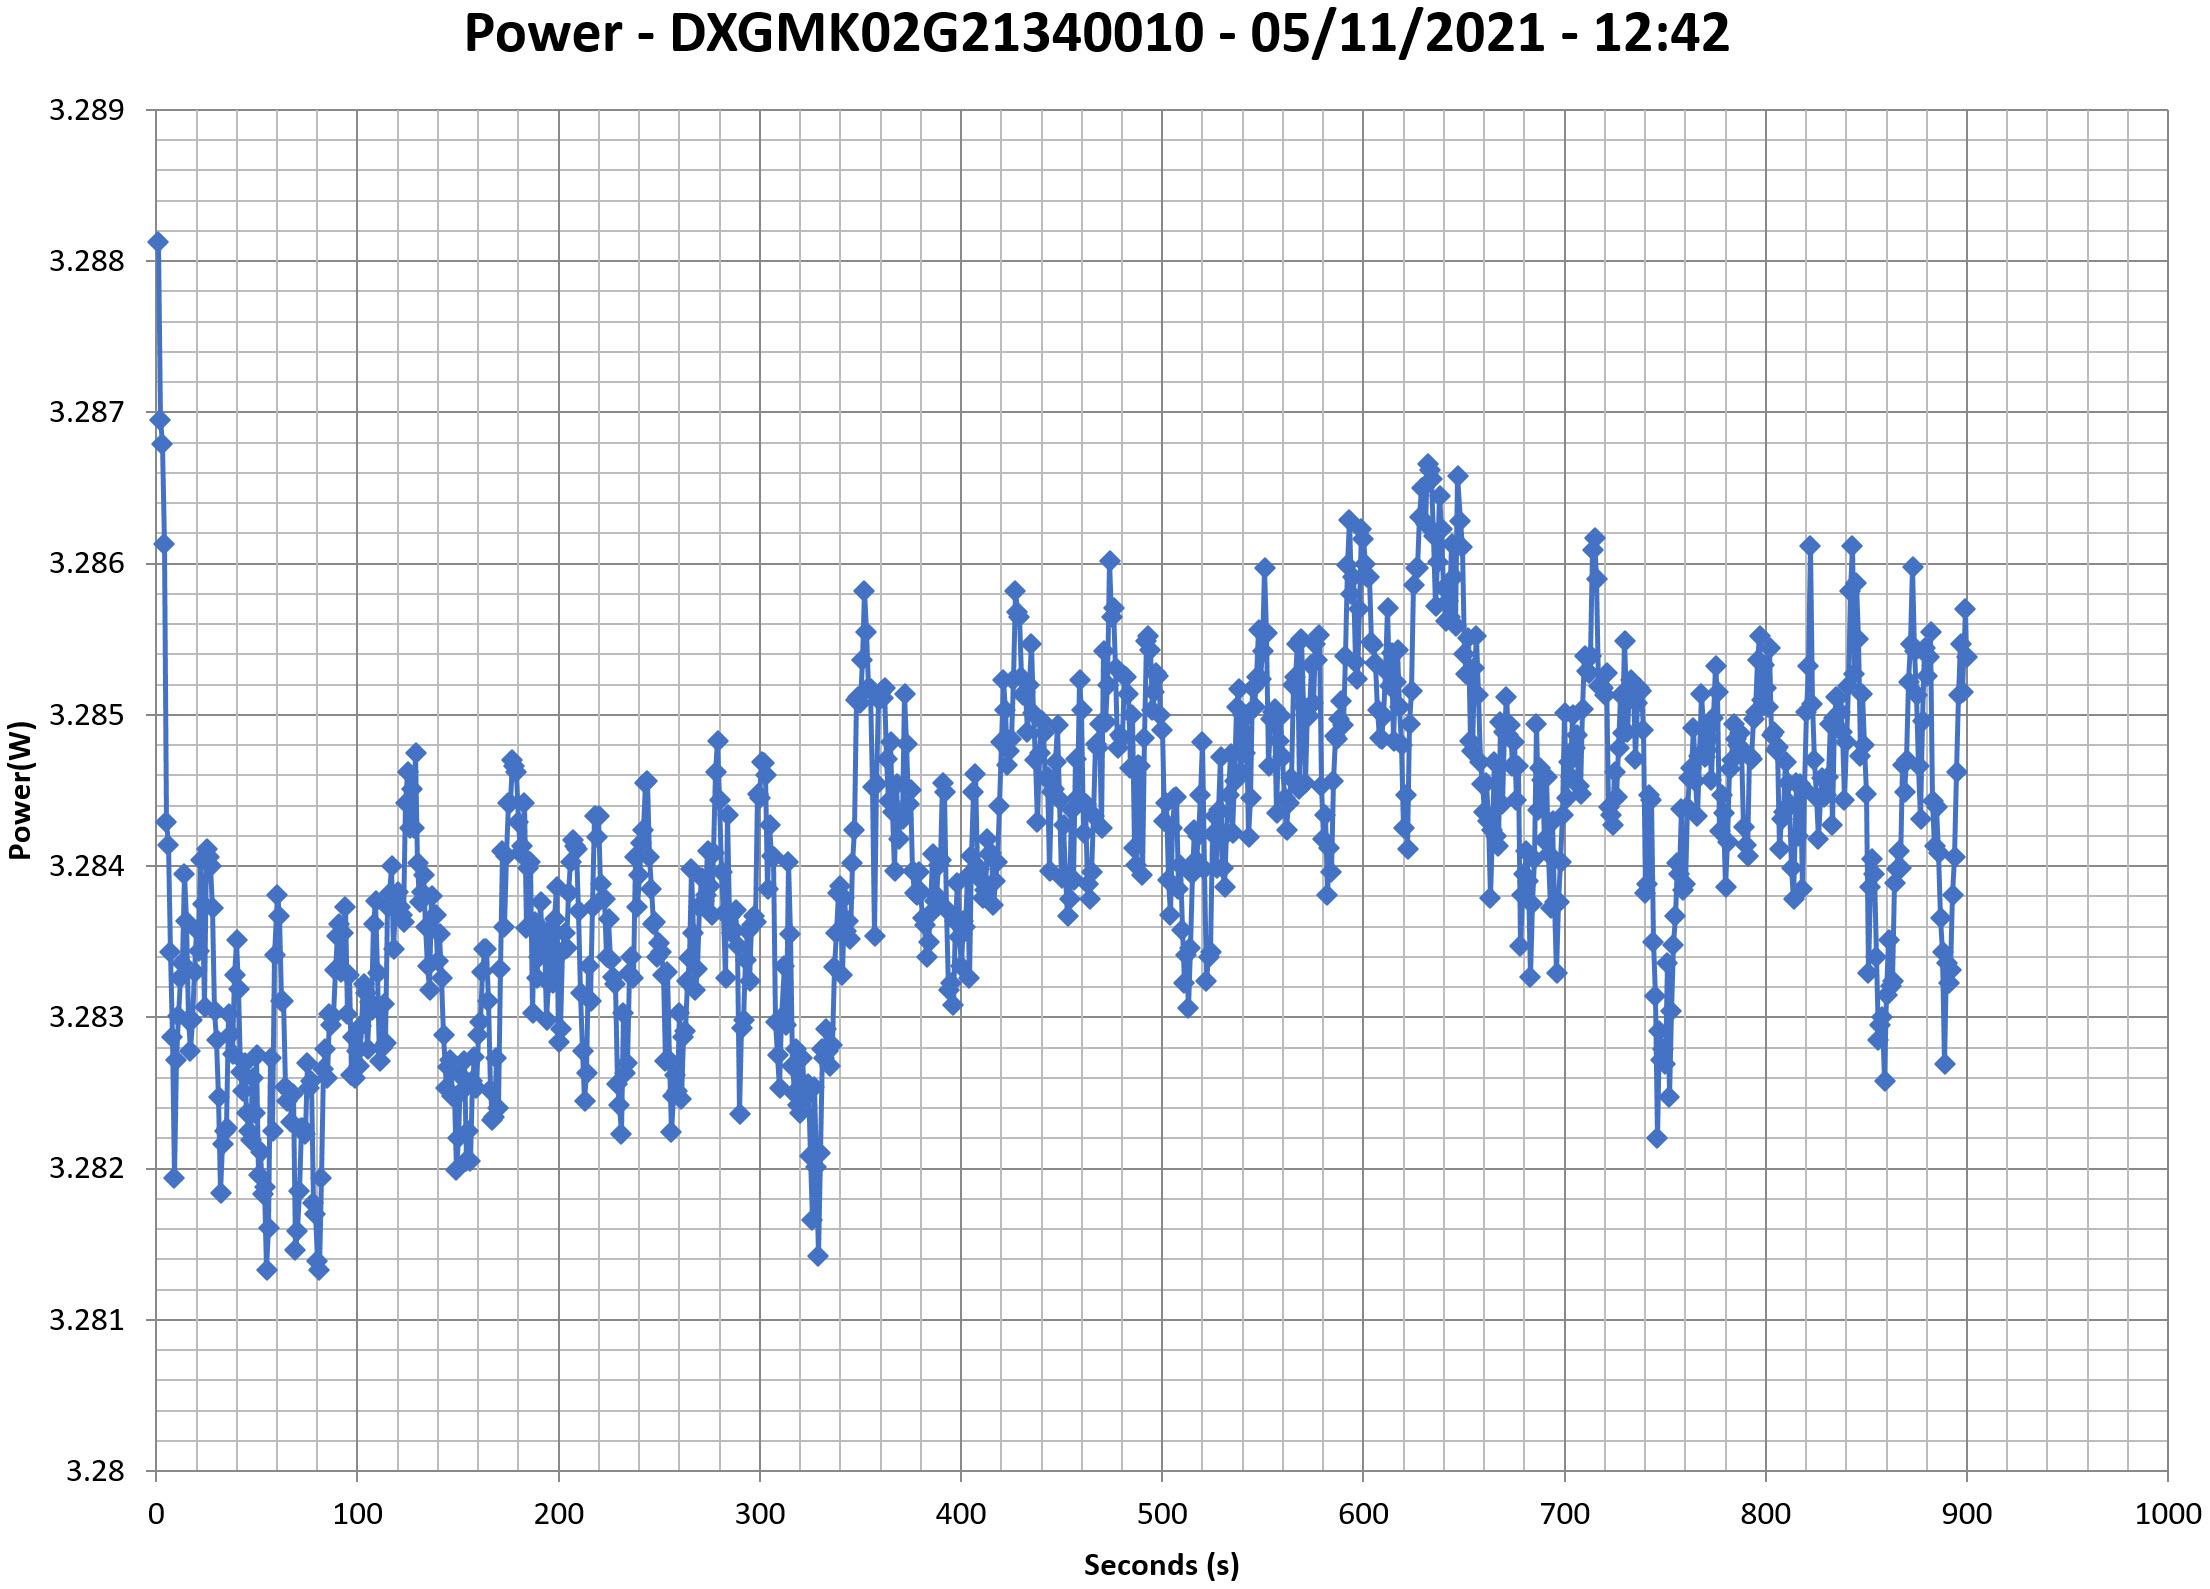
This graph is generated by the PPA Standby Power Analysis software which takes full control of the power analyzer during the whole procedure. This application features all of the EN50564 & IEC62301 test limits for standby power software testing
Efficiency Graph
230V
INFO
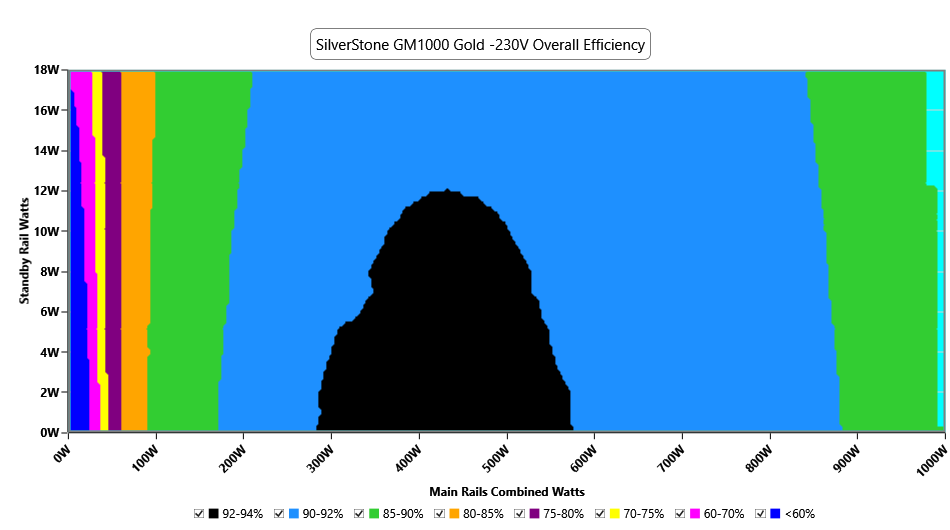
This graph depicts the PSU`s efficiency throughout its entire operational range. For the generation of the efficiency and noise graphs we set our loaders to auto mode through our custom-made software before trying thousands of possible load combinations
Noise Graph
230V
Indicative Performance
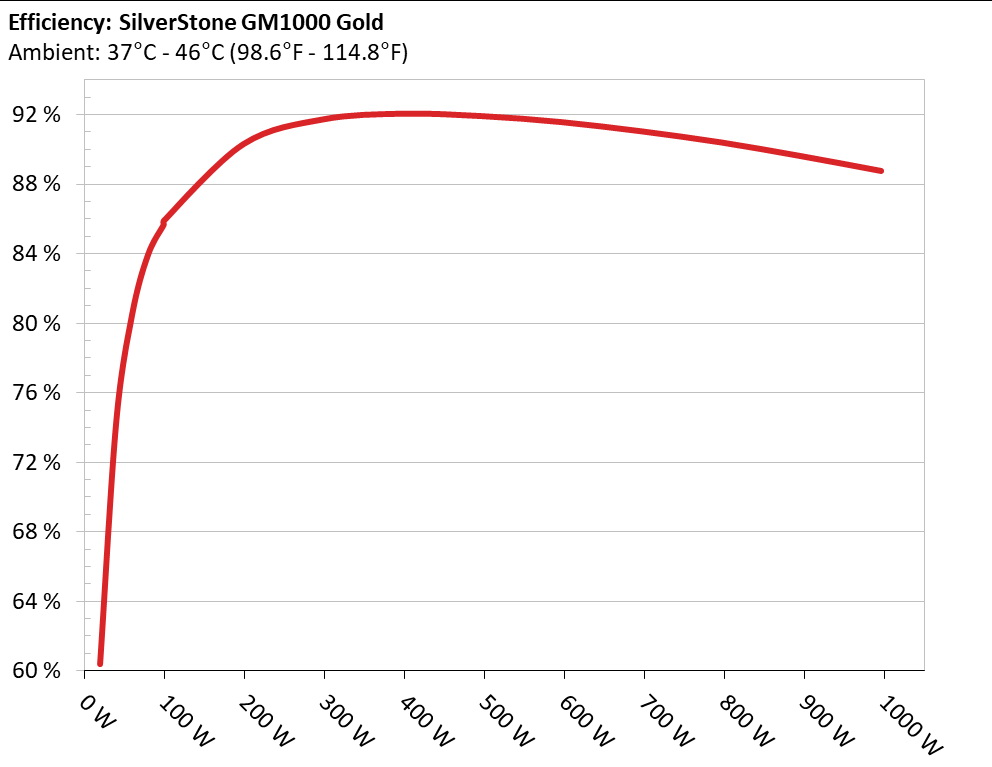
Efficiency under high ambient temperature
INFO
The PSU`s efficiency under high ambient temperatures with 115V and 230V input. For this graph the results of the 10-110% load regulation table are used
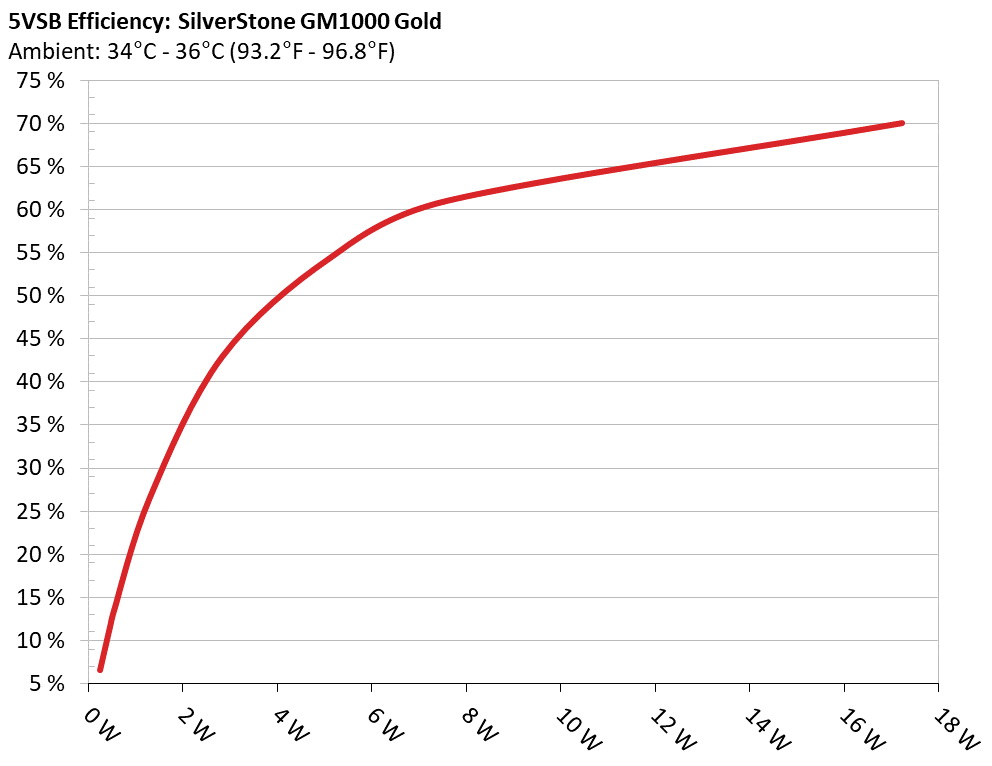
5VSB Efficiency
INFO
This graph depicts the efficiency levels of the 5VSB rail with 115V and 230V input
5VSB Efficiency (ERP LOT 3/6 & CEC) 230V
Test #
5VSB
DC/AC (Watts)
Efficiency
PF/AC Volts
1
0.045A
0.234W
6.547%
0.086
5.202V
3.574W
230.28V
2
0.09A
0.466W
12.108%
0.091
5.181V
3.849W
230.28V
3
0.55A
2.813W
42.881%
0.142
5.116V
6.56W
230.28V
4
1A
5.081W
54.308%
0.181
5.082V
9.356W
230.28V
5
1.5A
7.584W
61.023%
0.212
5.057V
12.429W
230.28V
6
3.499A
17.213W
70.038%
0.276
4.92V
24.577W
230.29V
Supplementary Tests (For Reference)
Typical Load Tests 230V
Test
Main Rail
Standby Rail
DC/AC (Watts)
Efficiency
Temps (In/Out)
PF/AC Volts
10%
7.784A
0.988A
99.543
85.699%
40.85°C
0.84
12.146V
5.058V
116.154
39.17°C
230.33V
20%
15.942A
1.191A
199.192
90.331%
41.27°C
0.903
12.119V
5.035V
220.512
43.75°C
230.33V
30%
24.125A
1.391A
298.761
91.755%
41.86°C
0.93
12.093V
5.033V
325.608
44.92°C
230.34V
40%
32.326A
1.597A
398.264
92.082%
42.16°C
0.949
12.073V
5.009V
432.512
45.19°C
230.33V
50%
40.614A
1.805A
497.699
91.942%
42.76°C
0.958
12.033V
4.987V
541.317
47.82°C
230.33V
60%
49.026A
2A
597.075
91.597%
43.16°C
0.966
11.976V
4.964V
651.849
48.57°C
230.34V
70%
57.569A
2.226A
696.607
91.067%
43.77°C
0.973
11.909V
4.94V
764.936
49.38°C
230.34V
80%
66.313A
2.334A
796.396
90.429%
44.39°C
0.978
11.836V
4.926V
880.692
51.62°C
230.34V
90%
75.188A
2.442A
896.166
89.639%
44.98°C
0.982
11.760V
4.912V
999.755
53.44°C
230.34V
100%
83.777A
3.631A
996.199
88.787%
45.93°C
0.985
11.682V
4.819V
1122.007
53.54°C
230.34V
The results above are not used in the certification process
Light Load Tests 230V
Test
Main Rail
Standby Rail
DC/AC (Watts)
Efficiency
Temps (In/Out)
PF/AC Volts
10W
1.561A
0.194A
19.995
60.403%
37.23°C
0.548
12.166V
5.152V
33.102
38.77°C
230.32V
20W
3.166A
0.292A
39.997
74.273%
38.44°C
0.692
12.159V
5.135V
53.851
40.41°C
230.32V
30W
4.771A
0.391A
59.994
80.512%
38.95°C
0.772
12.155V
5.117V
74.515
41.61°C
230.32V
40W
6.372A
0.489A
79.926
83.969%
39.38°C
0.813
12.151V
5.11V
95.185
42.42°C
230.33V
The results above are not used in the certification process
Ripple Measurements 230V
Test
Main Rail
Standby Rail
Pass/Fail
10% Load
25.9 mV
16.1 mV
Pass
20% Load
36.8 mV
16.7 mV
Pass
30% Load
53.6 mV
36.4 mV
Pass
40% Load
82.6 mV
38.1 mV
Pass
50% Load
159.6 mV
40.0 mV
Fail
60% Load
200.0 mV
42.9 mV
Fail
70% Load
200.0 mV
48.8 mV
Fail
80% Load
200.0 mV
51.9 mV
Fail
90% Load
200.0 mV
53.1 mV
Fail
100% Load
498.6 mV
67.1 mV
Fail
The results above are not used in the certification process
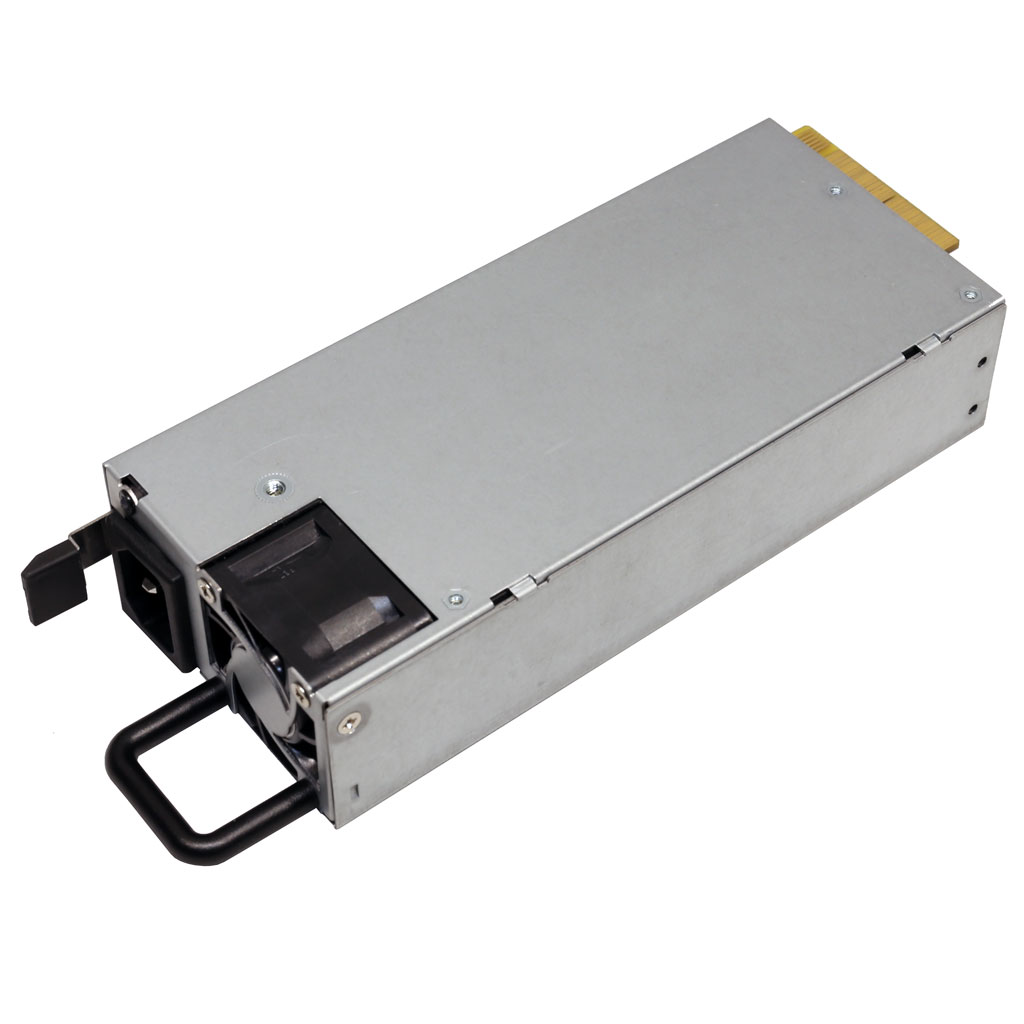
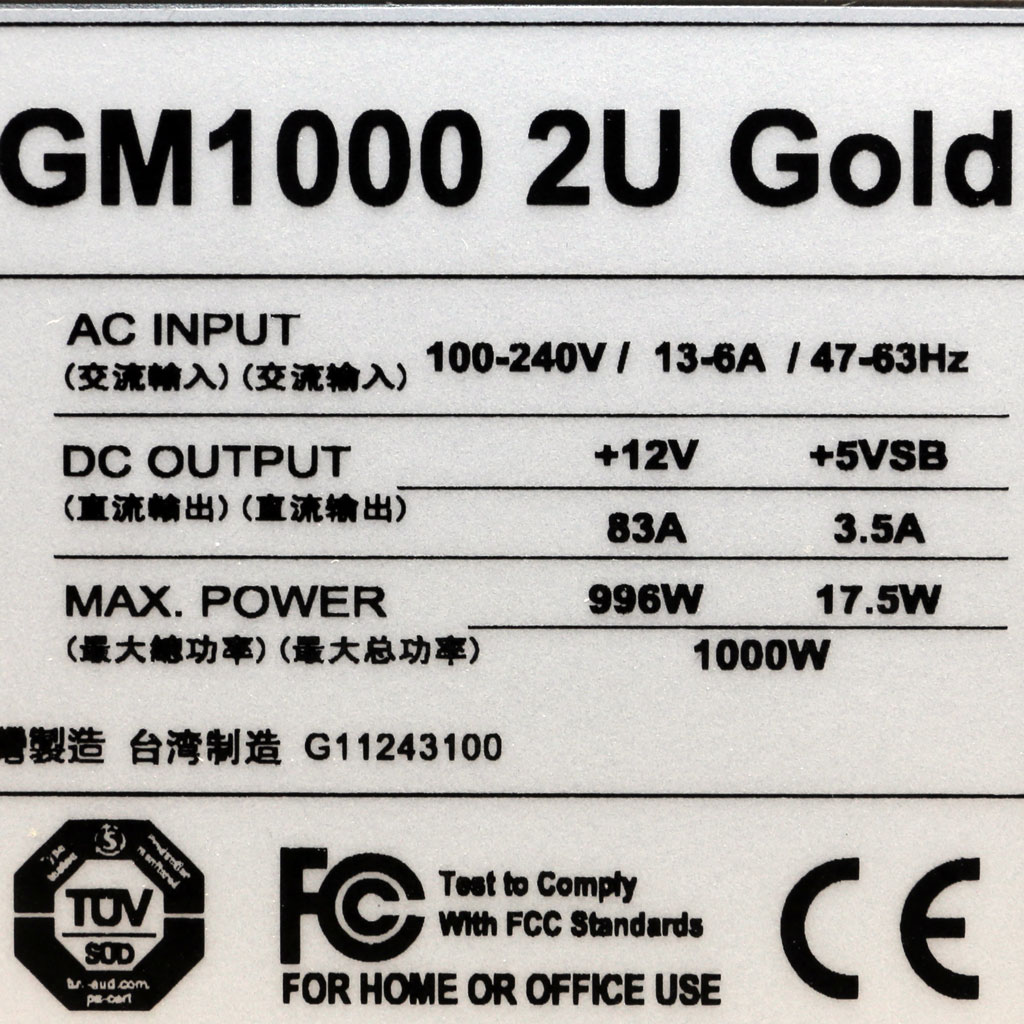
SilverStone GM1000 2U Gold
Top side
Power specifications label
All data and graphs included in this test report can be used by any individual on the following conditions: › It should be mentioned that the test results are provided by Cybenetics › The link to the original test results document should be provided in any case
Cybenetics offers the ETA and Lambda voluntary certification programs, through which the efficient and silent power supplies are promoted