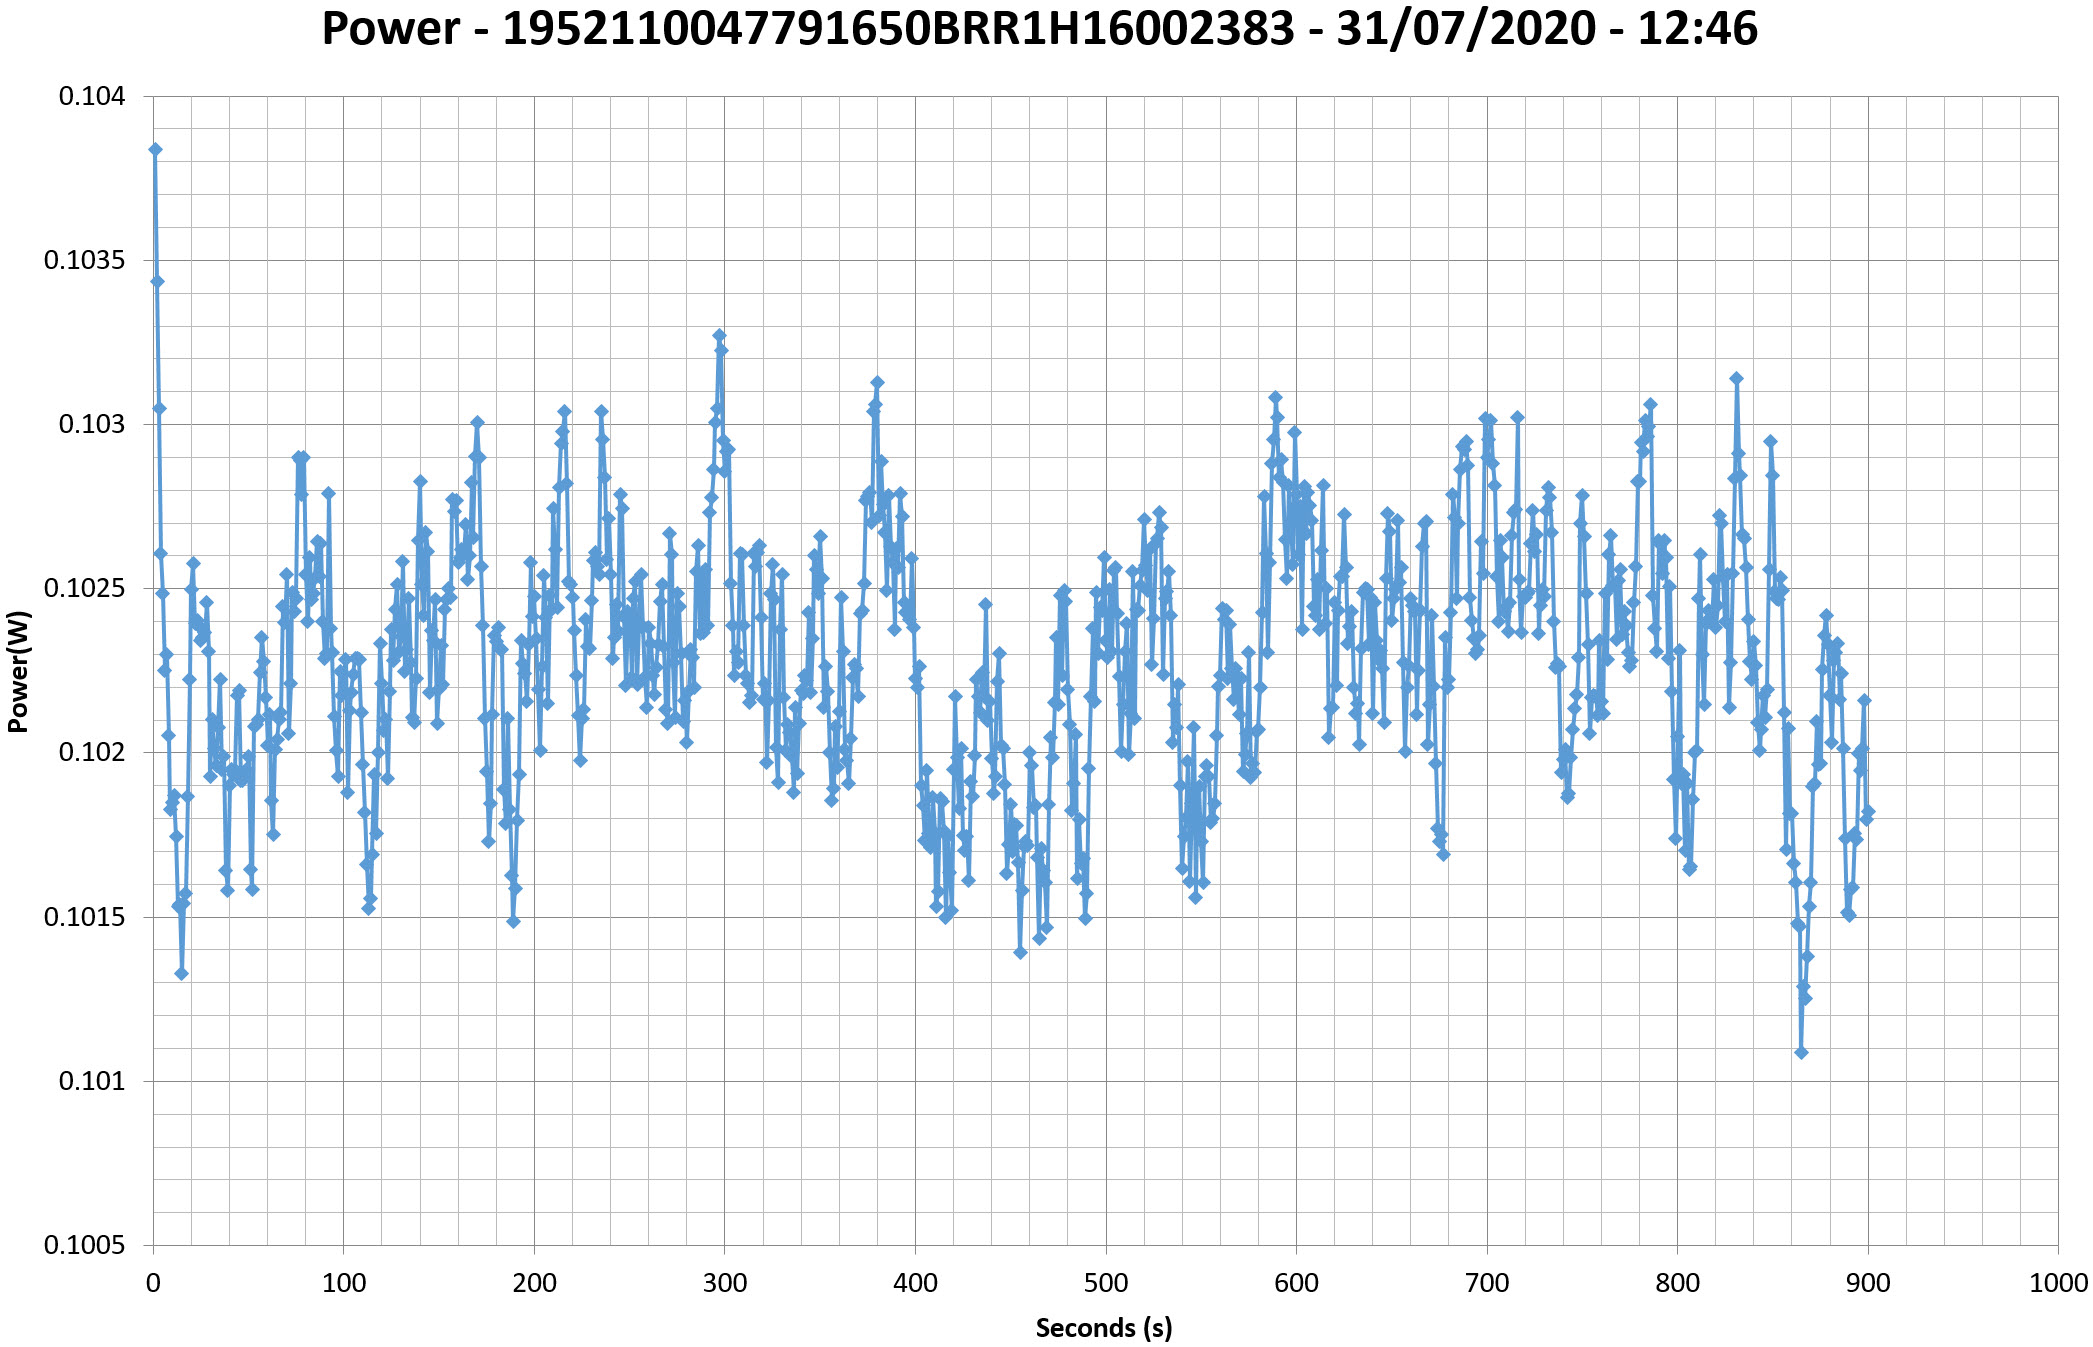
This graph is generated by the PPA Standby Power Analysis software which takes full control of the power analyzer during the whole procedure. This application features all of the EN50564 & IEC62301 test limits for standby power software testing
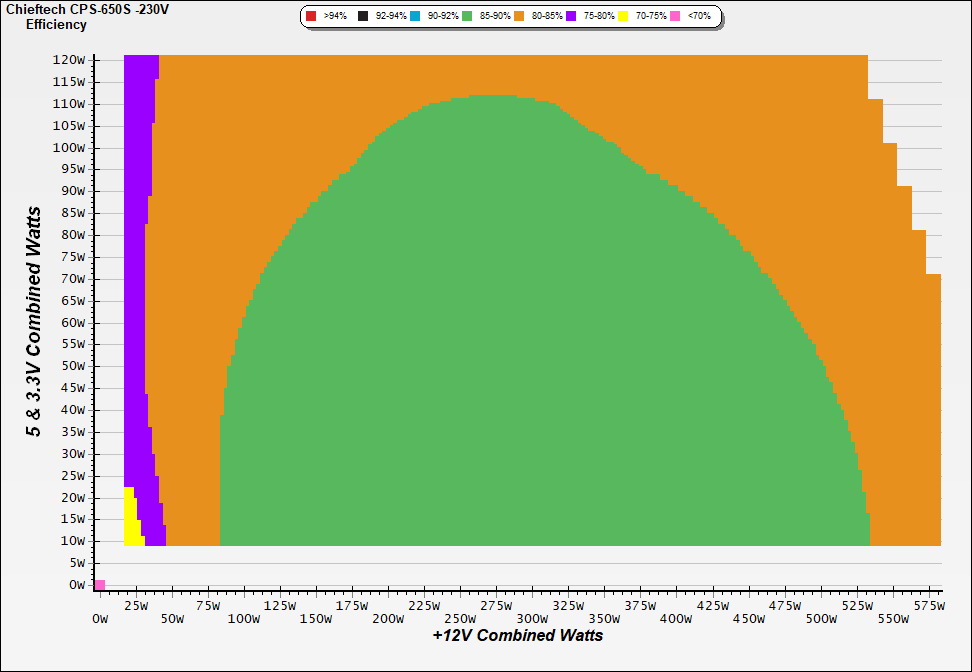
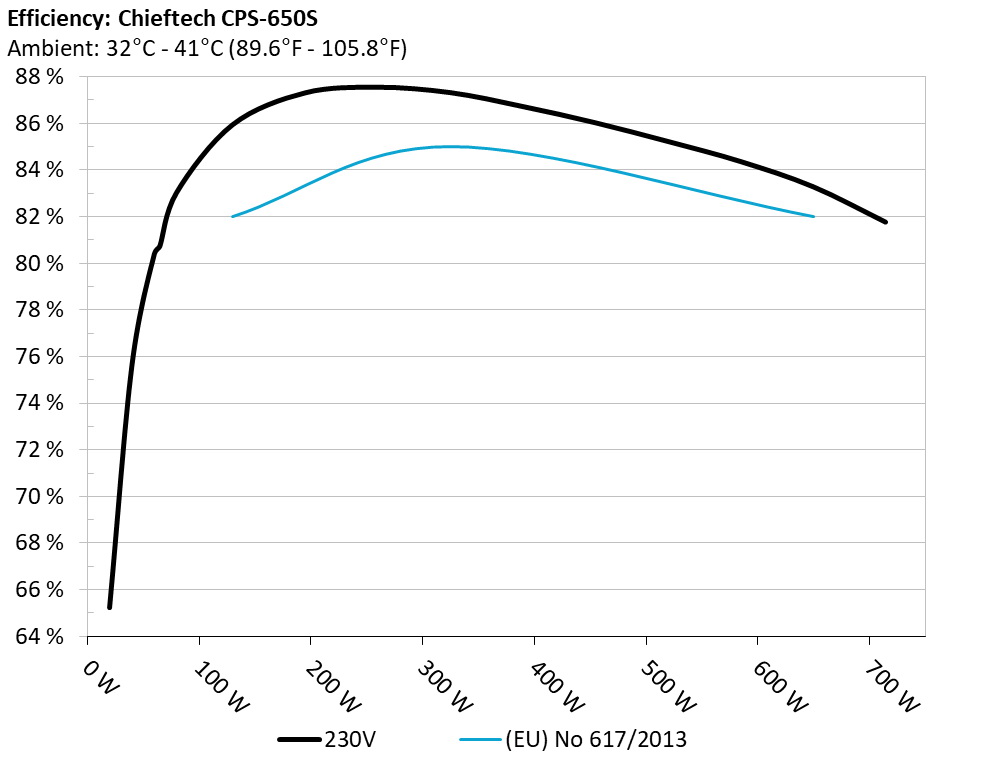
Efficiency Graph
230V
INFO
This graph depicts the PSU`s efficiency throughout its entire operational range. For the generation of the efficiency and noise graphs we set our loaders to auto mode through our custom-made software before trying thousands of possible load combinations
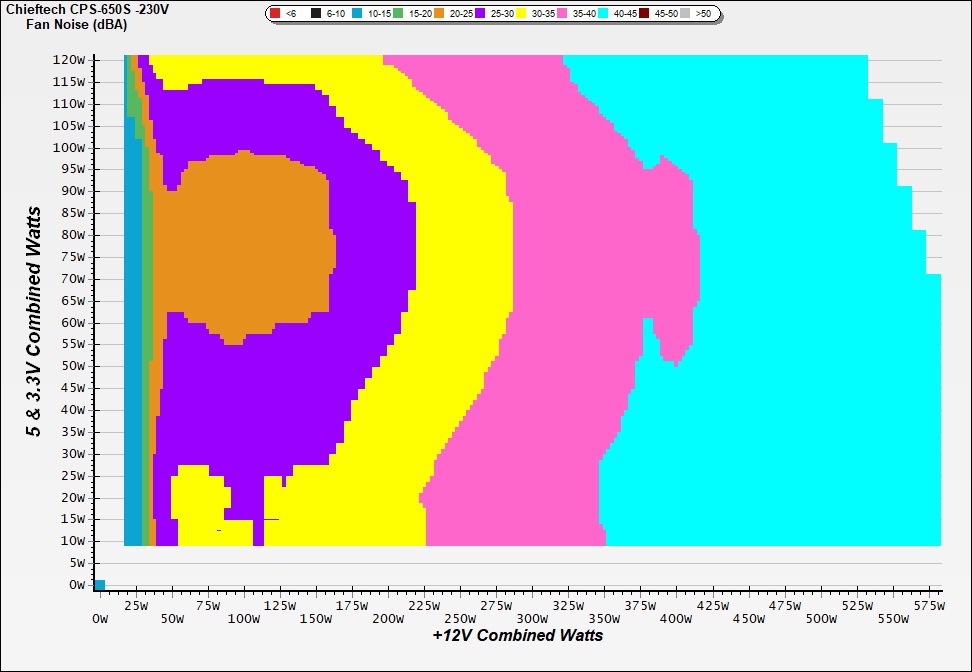
Noise Graph
230V
INFO
The PSU`s noise in its entire operational range and under 30-32 °C ambient is depicted in this graph. The X axis represents the load on the +12V rail(s) while the Y axis is the load on the minor rails
Conducted Emissions EN55032 & CISPR 32
Indicative Performance
Efficiency under high ambient temperature
INFO
The PSU`s efficiency under high ambient temperatures with 115V and 230V input. For this graph the results of the 10-110% load regulation table are used
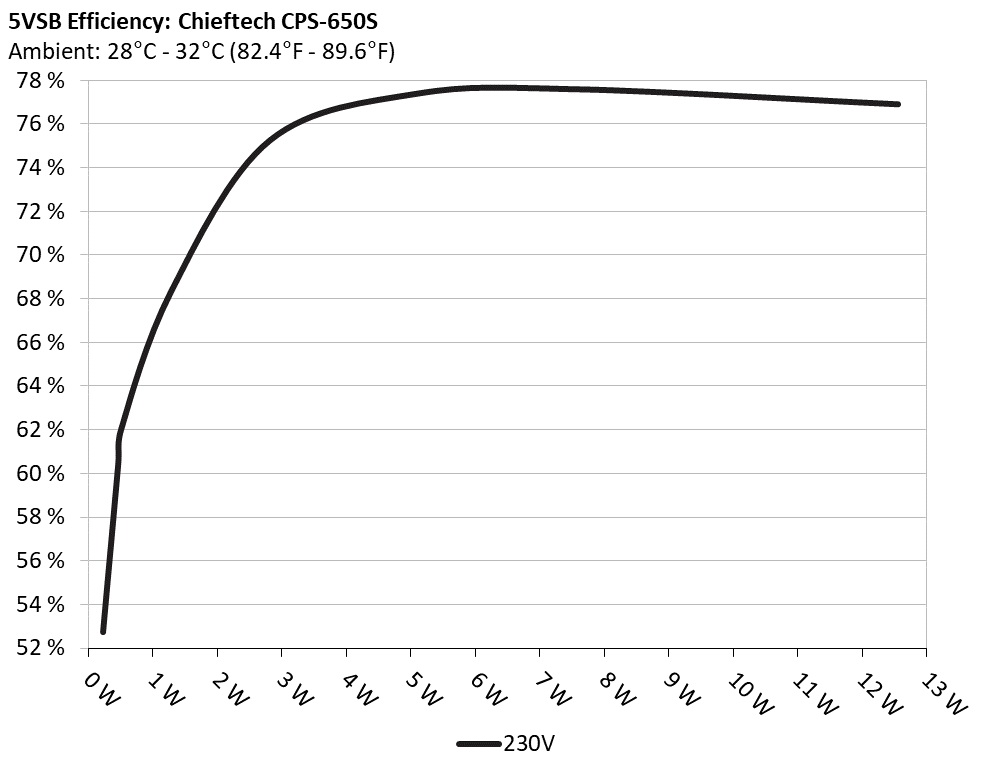
5VSB Efficiency
INFO
This graph depicts the efficiency levels of the 5VSB rail with 115V and 230V input
5VSB Efficiency (ERP LOT 3/6 & CEC) 230V
Test #
5VSB
DC/AC (Watts)
Efficiency
PF/AC Volts
1
0.045A
0.232
52.727%
0.022
5.155V
0.440
230.30V
2
0.090A
0.464
60.338%
0.039
5.153V
0.769
230.29V
3
0.550A
2.820
75.260%
0.162
5.129V
3.747
230.29V
4
1.000A
5.105
77.395%
0.234
5.105V
6.596
230.28V
5
1.500A
7.617
77.590%
0.284
5.078V
9.817
230.29V
6
2.499A
12.551
76.906%
0.337
5.022V
16.320
230.29V
Protection Features
Supplementary Tests (For Reference)
Typical Load Tests 230V
Test #
12V
5V
3.3V
5VSB
DC/AC (Watts)
Efficiency
Fan Speed (RPM)
PSU Noise (dB[A])
Temps (In/Out)
PF/AC Volts
1
3.578A
1.936A
1.957A
0.982A
64.956
80.728%
601
12.8
34.22°C
0.887
12.117V
5.168V
3.371V
5.091V
80.463
36.56°C
230.29V
2
8.196A
2.911A
2.946A
1.184A
130.005
85.928%
616
13.4
34.79°C
0.950
12.092V
5.152V
3.360V
5.070V
151.296
37.75°C
230.30V
3
13.210A
3.403A
3.447A
1.387A
195.001
87.293%
878
24.2
35.15°C
0.971
12.033V
5.140V
3.351V
5.049V
223.387
39.50°C
230.30V
4
18.234A
3.892A
3.952A
1.591A
259.997
87.534%
1096
29.8
35.66°C
0.979
11.999V
5.140V
3.341V
5.028V
297.025
40.47°C
230.30V
5
22.938A
4.885A
4.953A
1.798A
325.023
87.305%
1290
34.2
36.14°C
0.984
11.968V
5.119V
3.330V
5.006V
372.286
41.47°C
230.30V
6
27.590A
5.879A
5.967A
2.000A
389.346
86.714%
1601
39.4
36.30°C
0.988
11.945V
5.104V
3.320V
4.983V
449.000
42.88°C
230.30V
7
32.388A
6.888A
6.982A
2.218A
454.687
86.014%
1755
41.6
37.38°C
0.990
11.905V
5.083V
3.308V
4.959V
528.617
44.79°C
230.29V
8
37.150A
7.890A
8.006A
2.431A
520.008
85.207%
1876
43.3
37.56°C
0.991
11.887V
5.071V
3.297V
4.936V
610.290
46.49°C
230.29V
9
42.385A
8.377A
8.518A
2.437A
584.927
84.349%
1941
44.4
38.23°C
0.992
11.854V
5.073V
3.287V
4.924V
693.463
47.80°C
230.29V
10
47.649A
8.882A
9.065A
2.548A
649.648
83.272%
1952
44.5
39.04°C
0.992
11.804V
5.067V
3.276V
4.905V
780.151
49.66°C
230.30V
11
53.462A
8.876A
9.092A
2.554A
714.472
81.756%
1946
44.5
40.57°C
0.993
11.733V
5.070V
3.267V
4.893V
873.908
52.37°C
230.30V
CL1
0.100A
14.002A
13.998A
0.002A
113.578
76.230%
2043
45.8
36.31°C
0.952
12.716V
4.686V
3.335V
5.110V
148.994
41.93°C
230.31V
CL2
48.724A
1.002A
1.000A
1.000A
576.162
84.600%
1885
43.3
40.00°C
0.992
11.546V
5.264V
3.306V
5.014V
681.040
50.21°C
230.30V
The results above are not used in the certification process
Light Load Tests 230V
Test #
12V
5V
3.3V
5VSB
DC/AC (Watts)
Efficiency
Fan Speed (RPM)
PSU Noise (dB[A])
PF/AC Volts
1
1.227A
0.480A
0.488A
0.195A
19.984
65.239%
587
12.1
0.541
12.091V
5.203V
3.380V
5.142V
30.632
230.28V
2
2.453A
0.963A
0.978A
0.390A
39.974
75.627%
590
12.2
0.761
12.095V
5.195V
3.376V
5.128V
52.857
230.29V
3
3.681A
1.448A
1.468A
0.587A
60.006
80.394%
594
12.2
0.877
12.103V
5.181V
3.373V
5.114V
74.640
230.30V
4
4.904A
1.934A
1.959A
0.784A
79.957
83.023%
598
12.4
0.897
12.104V
5.171V
3.369V
5.100V
96.307
230.30V
The results above are not used in the certification process
Ripple Measurements 230V
Test
12V
5V
3.3V
5VSB
Pass/Fail
10% Load
12.40mV
8.80mV
16.20mV
10.50mV
Pass
20% Load
15.20mV
11.10mV
20.00mV
13.70mV
Pass
30% Load
18.20mV
13.80mV
24.40mV
17.10mV
Pass
40% Load
17.50mV
13.50mV
25.40mV
19.40mV
Pass
50% Load
19.60mV
14.40mV
33.00mV
22.60mV
Pass
60% Load
22.30mV
16.30mV
38.20mV
27.60mV
Pass
70% Load
26.30mV
19.00mV
44.60mV
34.30mV
Pass
80% Load
31.70mV
21.50mV
52.10mV
39.50mV
Fail
90% Load
35.40mV
22.90mV
57.90mV
45.50mV
Fail
100% Load
37.00mV
25.20mV
60.50mV
48.10mV
Fail
110% Load
37.30mV
30.10mV
64.10mV
52.40mV
Fail
Crossload1
25.80mV
80.00mV
45.00mV
19.90mV
Fail
Crossload2
35.40mV
28.80mV
58.30mV
47.70mV
Fail
The results above are not used in the certification process
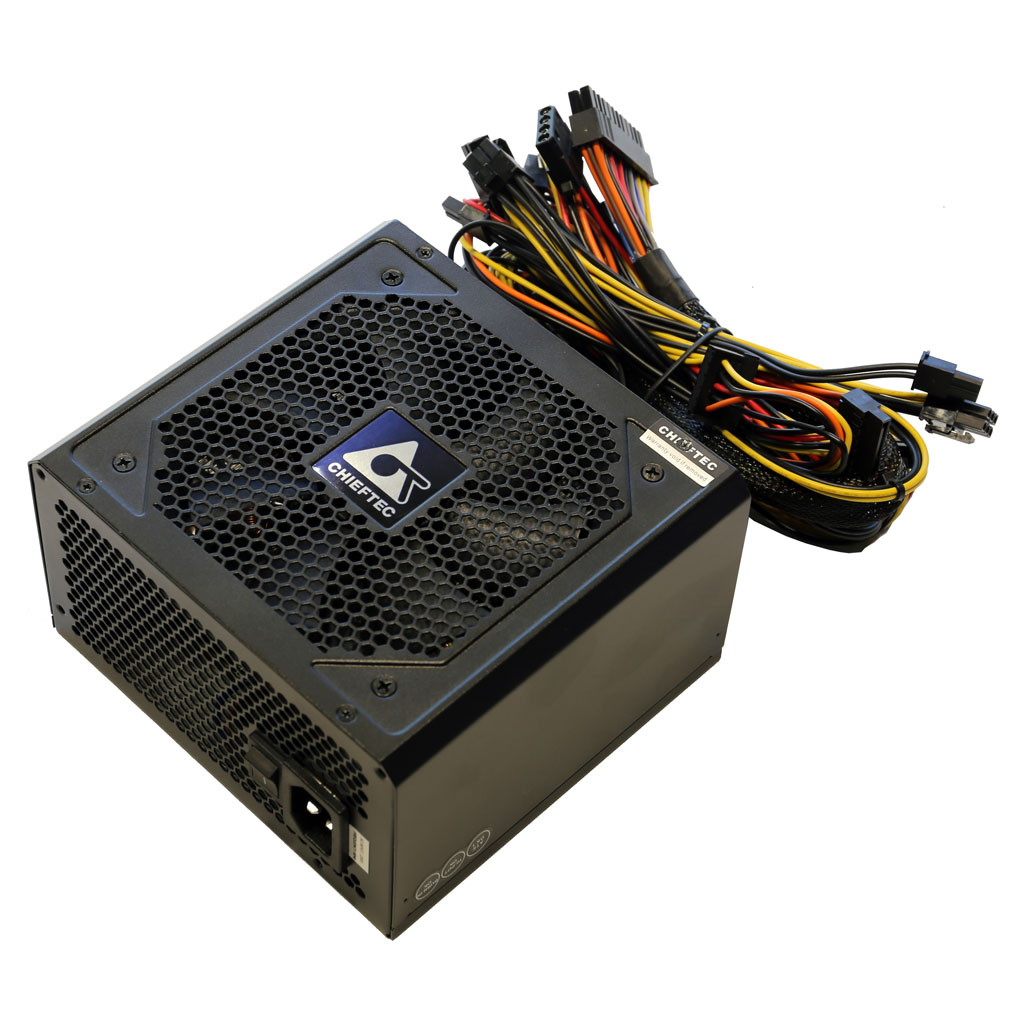
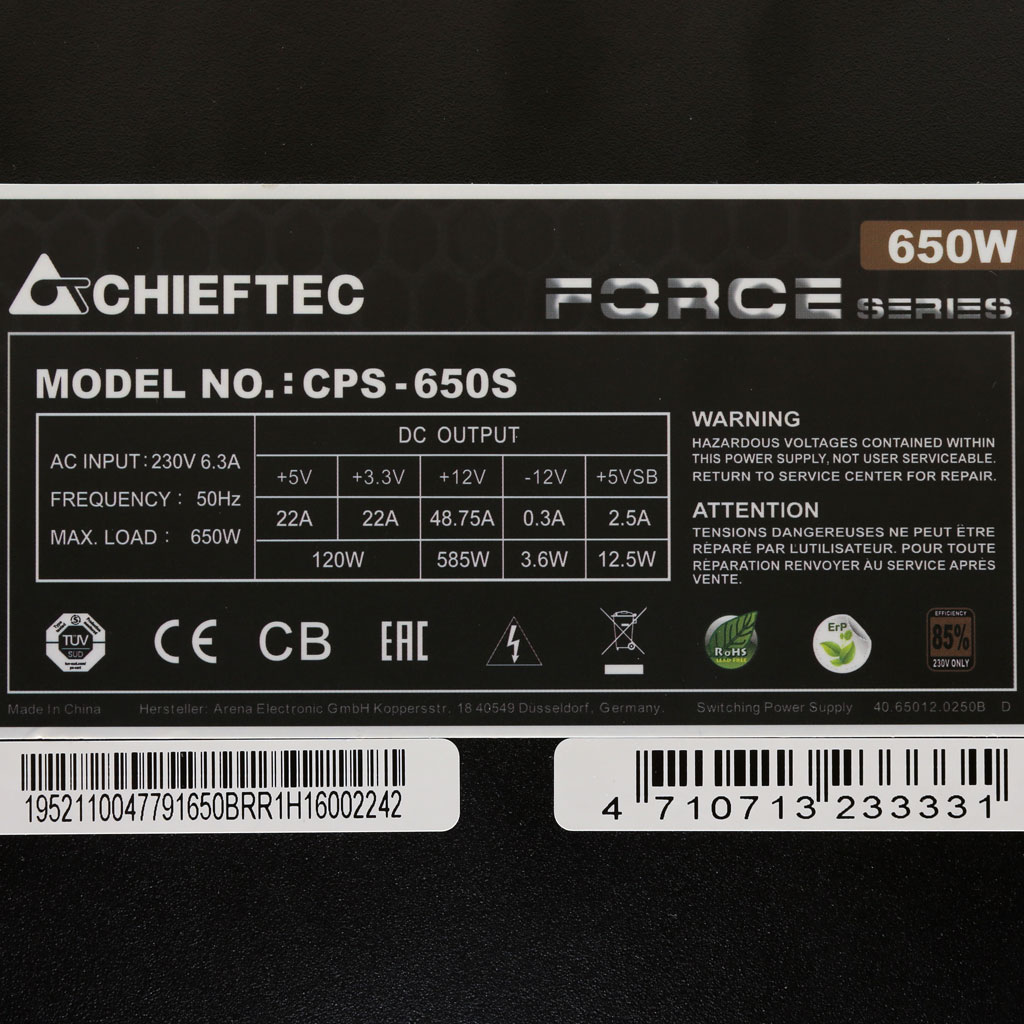
Chieftec Force 650W
Top side
Power specifications label
All data and graphs included in this test report can be used by any individual on the following conditions: › It should be mentioned that the test results are provided by Cybenetics › The link to the original test results document should be provided in any case
Cybenetics offers the ETA and Lambda voluntary certification programs, through which the efficient and silent power supplies are promoted