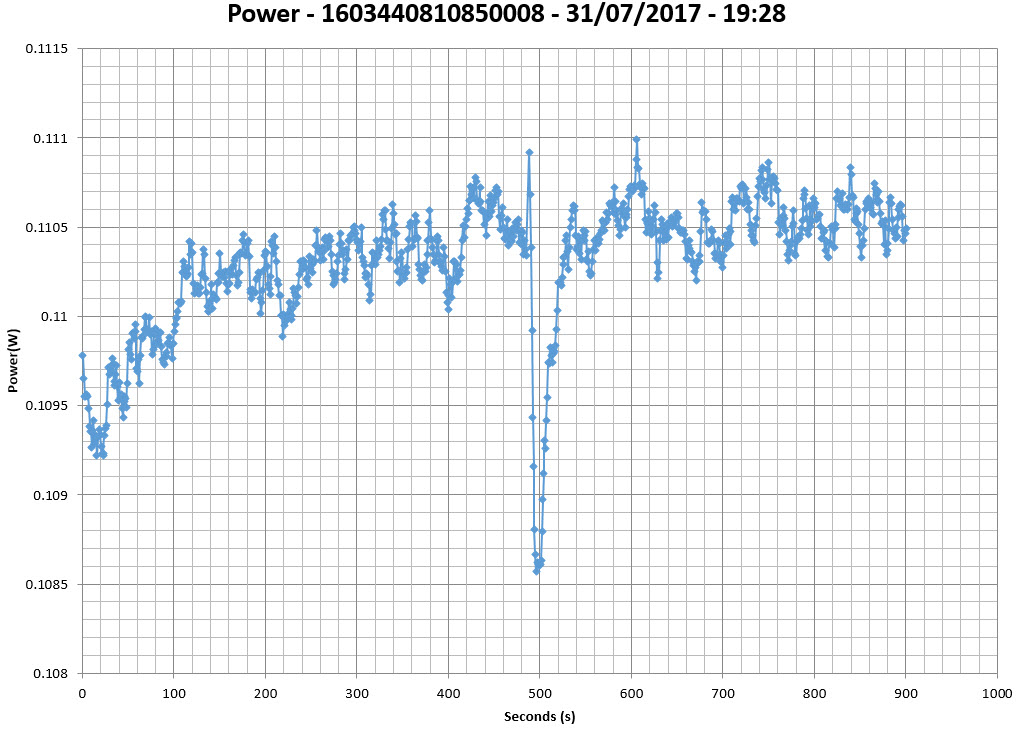
This graph is generated by the PPA Standby Power Analysis software which takes full control of the power analyzer during the whole procedure. This application features all of the EN50564 & IEC62301 test limits for standby power software testing.
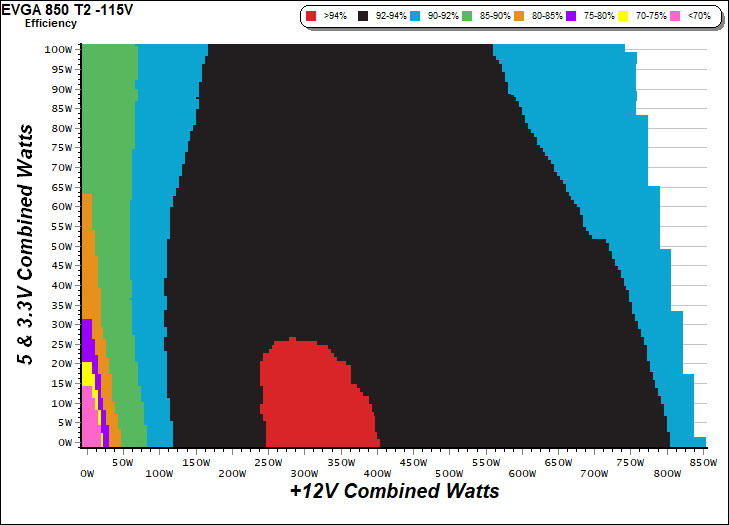
Efficiency Graph
115V
INFO
This graph depicts the PSU`s efficiency throughout its entire operational range. For the generation of the efficiency and noise graphs we set our loaders to auto mode through our custom-made software before trying thousands of possible load combinations.
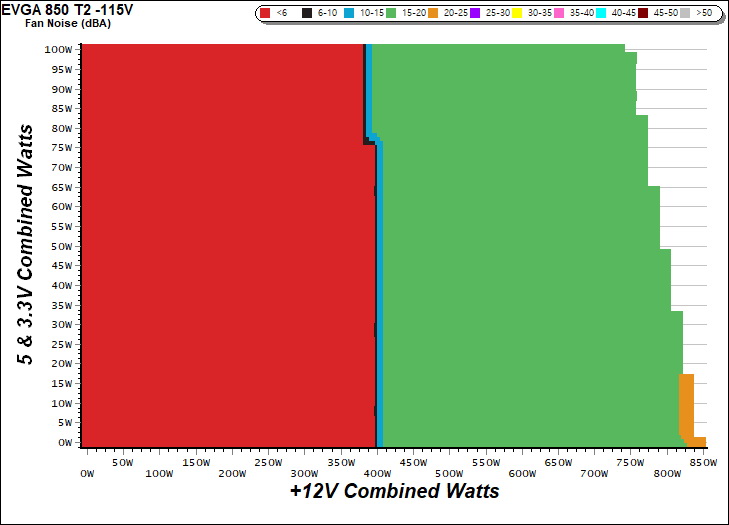
Noise Graph
115V
INFO
The PSU`s noise in its entire operational range and under 30-32 °C ambient is depicted in this graph. The X axis represents the load on the +12V rail(s) while the Y axis is the load on the minor rails.
Indicative Performance
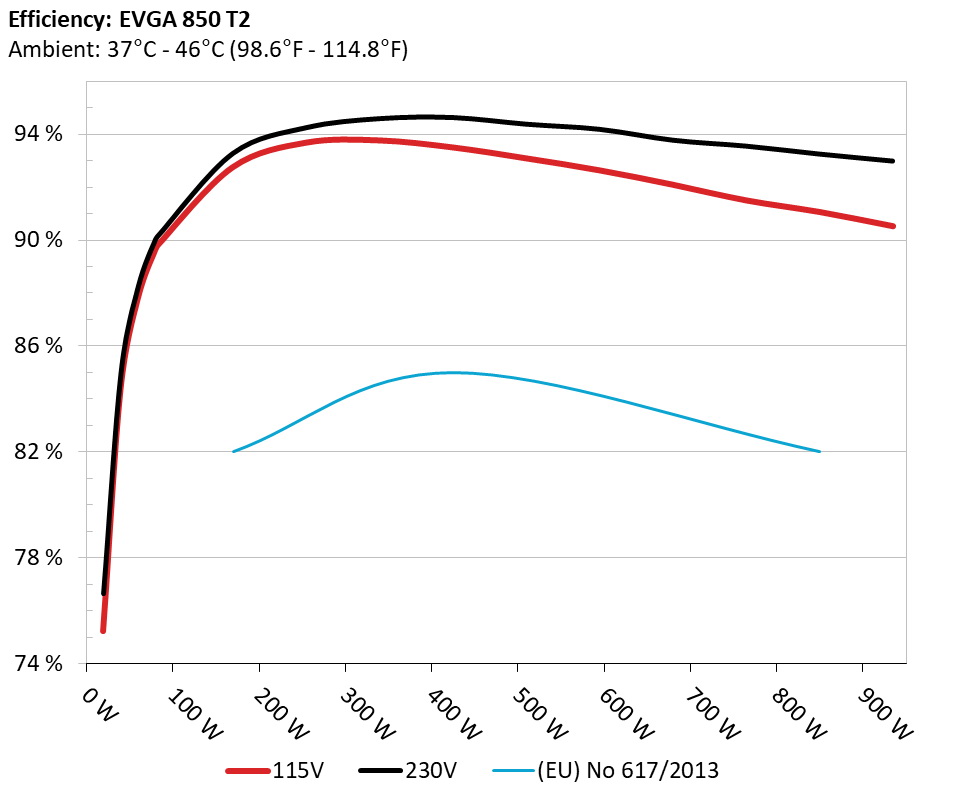
Efficiency under high ambient temperature
INFO
The PSU`s efficiency under high ambient temperatures with 115V and 230V input. For this graph the results of the 10-110% load regulation table are used.
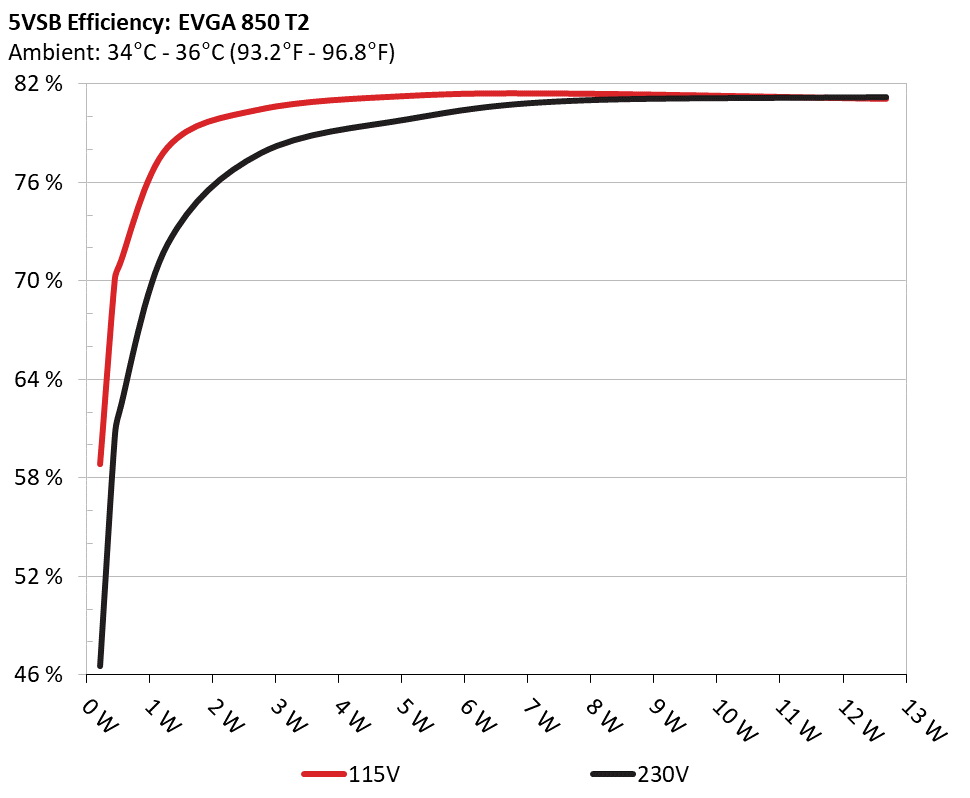
5VSB Efficiency
INFO
This graph depicts the efficiency levels of the 5VSB rail with 115V and 230V input.
5VSB Efficiency (ERP LOT 3/6 & CEC) 115V
Test #
5VSB
DC/AC (Watts)
Efficiency
PF/AC Volts
1
0.042A
0.213
58.840%
0.016
5.113V
0.362
115.14V
2
0.087A
0.445
70.079%
0.029
5.112V
0.635
115.14V
3
0.542A
2.766
80.477%
0.146
5.103V
3.437
115.11V
4
1.002A
5.106
81.293%
0.240
5.096V
6.281
115.12V
5
1.502A
7.638
81.429%
0.316
5.086V
9.380
115.13V
6
2.501A
12.676
81.111%
0.407
5.068V
15.628
115.13V
Supplementary Tests (For Reference)
Typical Load Tests 115V
Test #
12V
5V
3.3V
5VSB
DC/AC (Watts)
Efficiency
Fan Speed (RPM)
Fan Noise (dB[A])
Temps (In/Out)
PF/AC Volts
1
5.167A
1.987A
1.986A
0.981A
84.781
89.888%
0
| 6
42.98°C
0.944
12.227V
5.042V
3.318V
5.093V
94.319
38.33°C
115.19V
2
11.355A
2.971A
2.984A
1.176A
169.619
92.763%
0
| 6
43.74°C
0.976
12.222V
5.036V
3.316V
5.086V
182.852
38.79°C
115.19V
3
17.910A
3.479A
3.498A
1.375A
254.903
93.695%
0
| 6
44.37°C
0.988
12.218V
5.032V
3.313V
5.079V
272.057
39.24°C
115.19V
4
24.446A
3.976A
3.982A
1.575A
339.732
93.777%
0
| 6
45.16°C
0.994
12.213V
5.029V
3.312V
5.073V
362.276
39.81°C
115.18V
5
30.643A
4.975A
4.982A
1.776A
424.628
93.514%
0
| 6
46.39°C
0.995
12.210V
5.023V
3.310V
5.066V
454.080
40.83°C
115.18V
6
36.854A
5.978A
5.985A
1.975A
509.656
93.099%
0
| 6
48.16°C
0.996
12.207V
5.018V
3.307V
5.058V
547.435
42.35°C
115.17V
7
43.074A
6.987A
6.986A
2.175A
594.605
92.647%
620
14.3
42.51°C
0.997
12.200V
5.013V
3.305V
5.052V
641.795
50.13°C
115.17V
8
49.297A
7.990A
7.994A
2.375A
679.514
92.102%
620
14.3
43.16°C
0.997
12.194V
5.008V
3.302V
5.043V
737.787
54.18°C
115.16V
9
55.950A
8.492A
8.516A
2.379A
764.562
91.510%
940
23.6
44.62°C
0.998
12.189V
5.005V
3.299V
5.040V
835.498
56.85°C
115.17V
10
62.566A
9.010A
9.004A
2.480A
849.404
91.072%
1315
33.7
45.63°C
0.998
12.182V
5.000V
3.297V
5.036V
932.678
58.42°C
115.16V
11
69.563A
9.014A
9.015A
2.480A
934.307
90.537%
1315
33.7
46.20°C
0.998
12.177V
4.998V
3.295V
5.033V
1031.966
59.80°C
115.17V
CL1
0.099A
12.014A
12.006A
0.004A
101.293
86.385%
930
23.5
44.16°C
0.961
12.231V
5.016V
3.315V
5.102V
117.258
54.75°C
115.20V
CL2
70.786A
1.004A
1.003A
1.002A
875.458
91.483%
930
23.5
44.88°C
0.998
12.178V
5.018V
3.297V
5.071V
956.962
57.89°C
115.17V
The results above are not used in the certification process
Light Load Tests 115V
Test #
12V
5V
3.3V
5VSB
DC/AC (Watts)
Efficiency
Fan Speed (RPM)
Fan Noise (dB[A])
PF/AC Volts
1
1.194A
0.495A
0.479A
0.196A
19.691
75.231%
0
| 6
0.715
12.227V
5.050V
3.321V
5.112V
26.174
115.17V
2
2.411A
0.991A
0.993A
0.391A
39.773
84.352%
0
| 6
0.863
12.227V
5.047V
3.320V
5.105V
47.151
115.18V
3
3.633A
1.478A
1.505A
0.586A
59.860
87.811%
0
| 6
0.918
12.227V
5.044V
3.319V
5.100V
68.169
115.18V
4
4.842A
1.985A
1.985A
0.782A
79.778
89.627%
0
| 6
0.941
12.226V
5.042V
3.318V
5.096V
89.011
115.18V
The results above are not used in the certification process
Ripple Measurements 115V
Test
12V
5V
3.3V
5VSB
Pass/Fail
10% Load
4.5 mV
5.0 mV
5.9 mV
5.7 mV
Pass
20% Load
6.1 mV
6.1 mV
6.8 mV
6.3 mV
Pass
30% Load
6.8 mV
6.3 mV
7.0 mV
7.4 mV
Pass
40% Load
8.3 mV
7.3 mV
8.7 mV
8.2 mV
Pass
50% Load
8.8 mV
8.1 mV
9.3 mV
10.1 mV
Pass
60% Load
9.6 mV
8.6 mV
10.6 mV
10.9 mV
Pass
70% Load
9.2 mV
9.3 mV
11.3 mV
10.1 mV
Pass
80% Load
10.1 mV
10.6 mV
12.8 mV
11.6 mV
Pass
90% Load
11.0 mV
10.8 mV
13.4 mV
11.7 mV
Pass
100% Load
10.4 mV
13.1 mV
13.0 mV
13.8 mV
Pass
110% Load
11.2 mV
14.1 mV
14.4 mV
14.4 mV
Pass
Crossload 1
6.7 mV
7.3 mV
8.1 mV
13.6 mV
Pass
Crossload 2
9.8 mV
12.9 mV
12.8 mV
14.3 mV
Pass
The results above are not used in the certification process
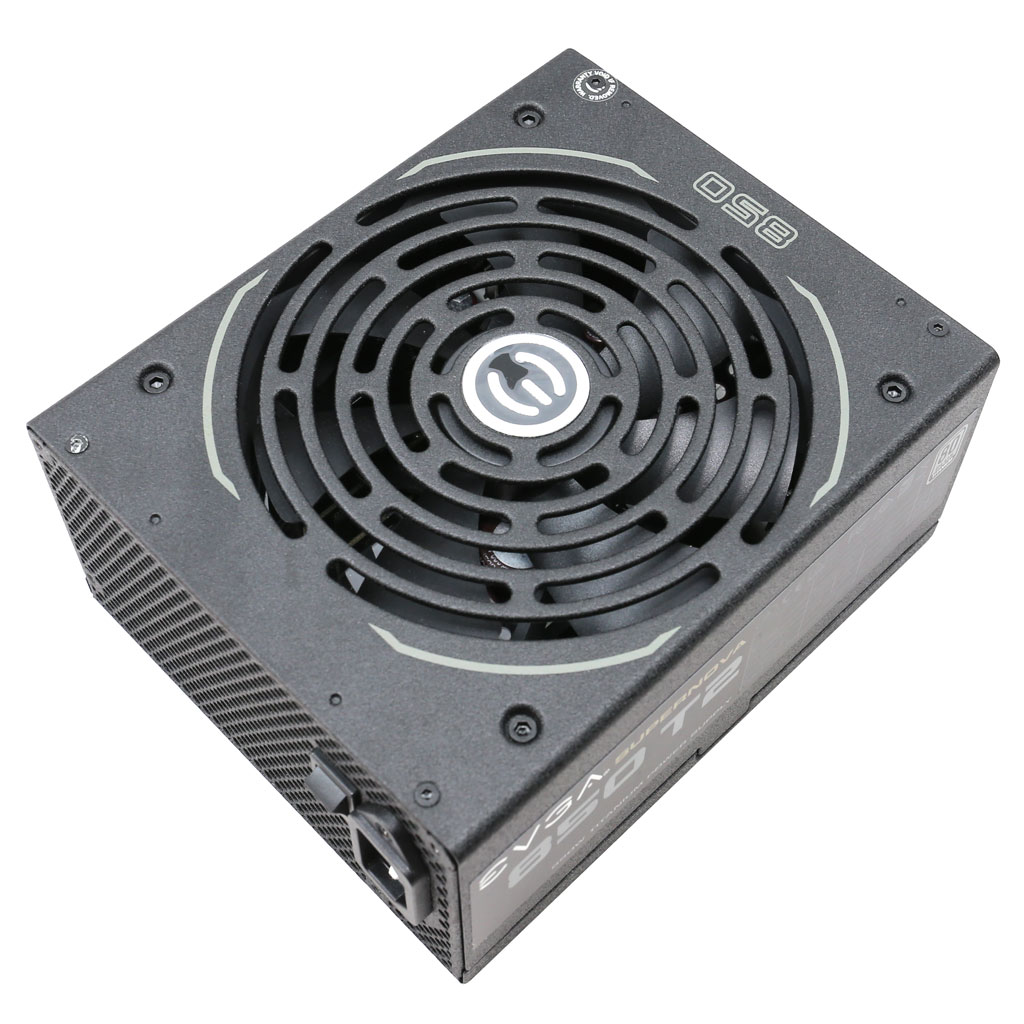
EVGA SuperNOVA 850 T2
Top side
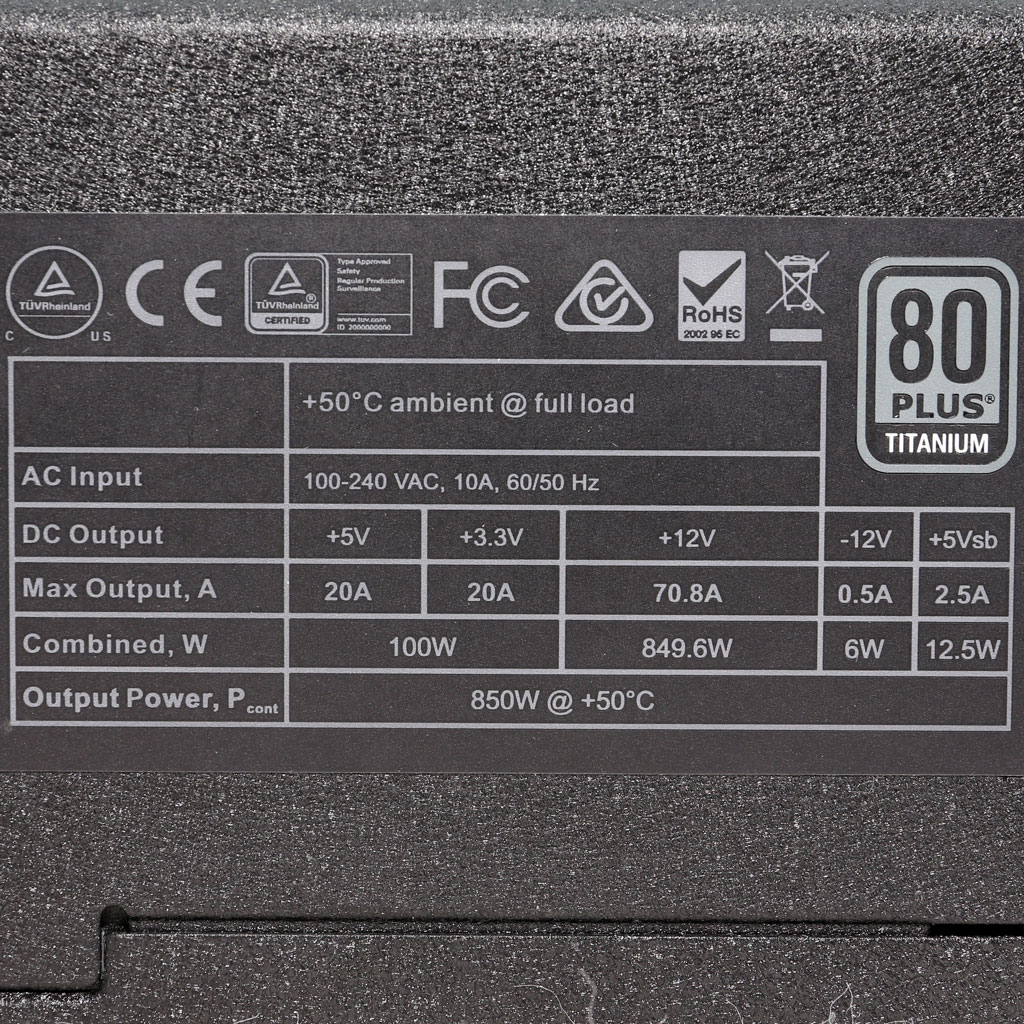
Power specifications label
All data and graphs included in this test report can be used by any individual on the following conditions: › It should be mentioned that the test results are provided by Cybenetics › The link to the original test results document should be provided in any case
Cybenetics offers the ETA and Lambda voluntary certification programs, through which the efficient and silent power supplies are promoted