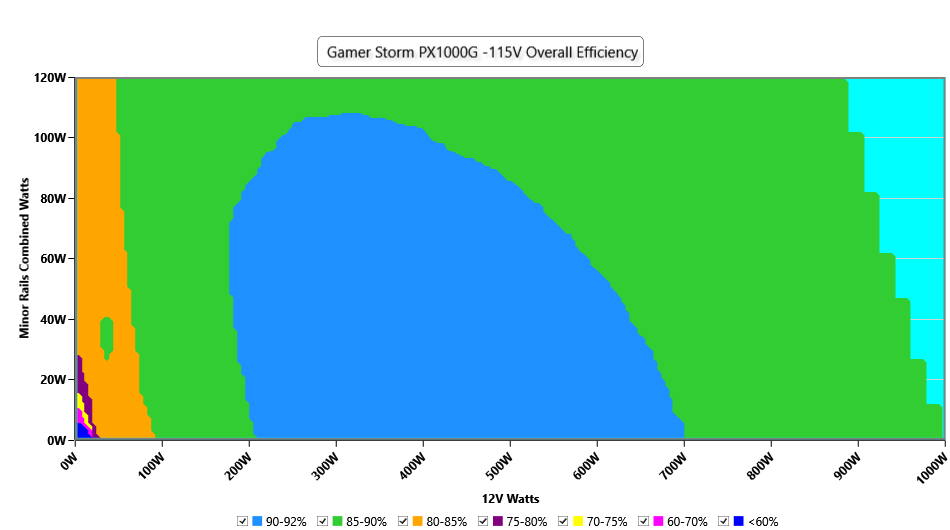
This graph depicts the PSU`s efficiency throughout its entire operational range. For the generation of the efficiency and noise graphs we set our loaders to auto mode through our custom-made software before trying thousands of possible load combinations
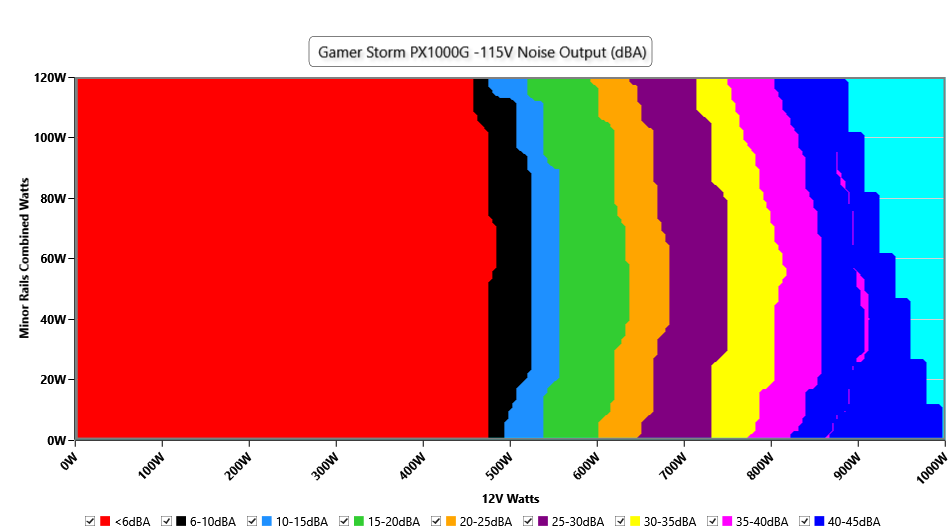
Noise Graph
115V
INFO
The PSU`s noise in its entire operational range and under 30-32 °C ambient is depicted in this graph. The X axis represents the load on the +12V rail(s) while the Y axis is the load on the minor rails
Indicative Performance
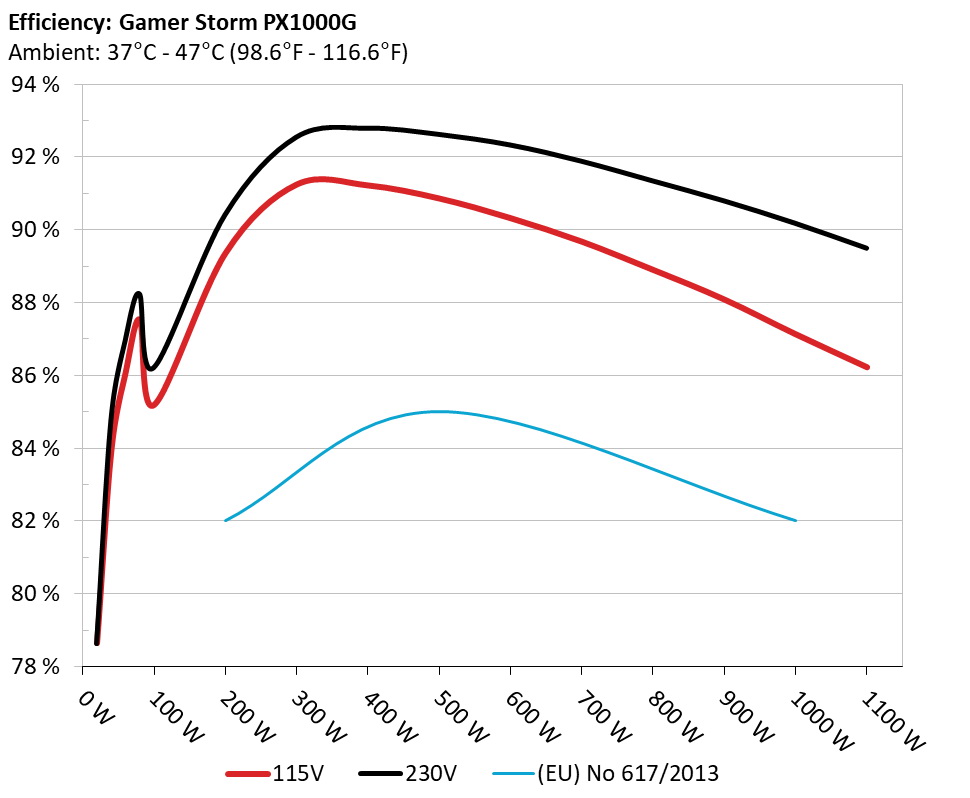
Efficiency under high ambient temperature
INFO
The PSU`s efficiency under high ambient temperatures with 115V and 230V input. For this graph the results of the 10-110% load regulation table are used
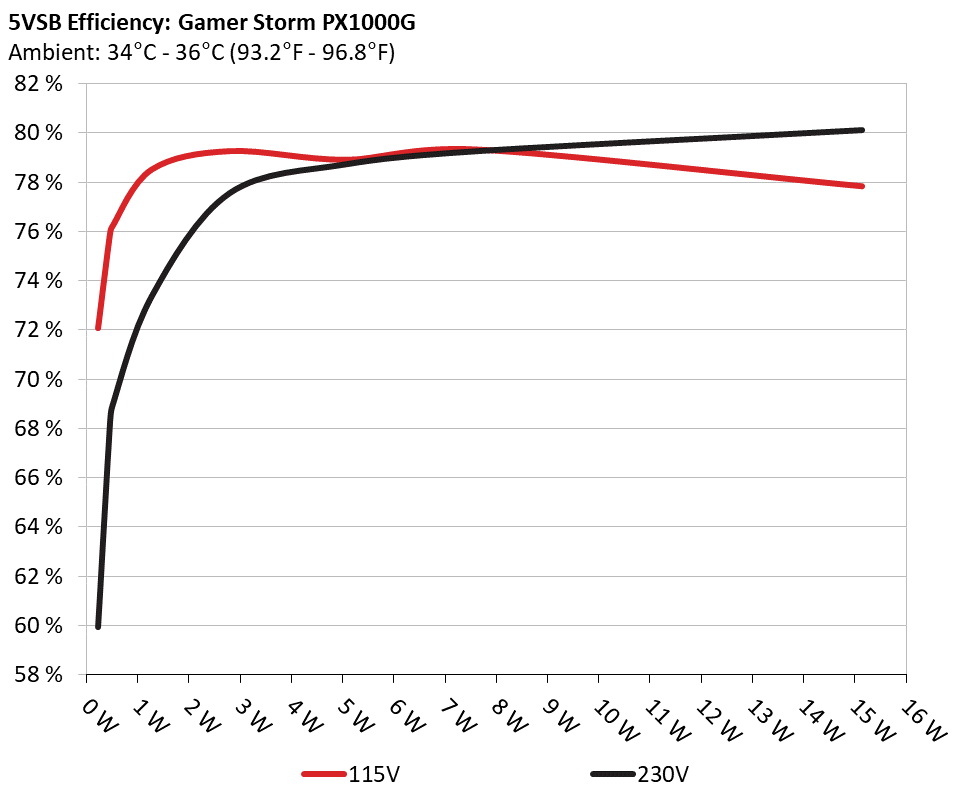
5VSB Efficiency
INFO
This graph depicts the efficiency levels of the 5VSB rail with 115V and 230V input
5VSB Efficiency (ERP LOT 3/6 & CEC) 115V
Test #
5VSB
DC/AC (Watts)
Efficiency
PF/AC Volts
1
0.045A
0.229W
72.081%
0.031
5.098V
0.318W
115.08V
2
0.09A
0.459W
75.885%
0.058
5.097V
0.605W
115.08V
3
0.55A
2.799W
79.282%
0.269
5.089V
3.53W
115.08V
4
1A
5.082W
78.926%
0.372
5.081V
6.439W
115.08V
5
1.5A
7.609W
79.349%
0.425
5.072V
9.589W
115.08V
6
3A
15.138W
77.852%
0.495
5.045V
19.445W
115.08V
Supplementary Tests (For Reference)
Typical Load Tests 115V
Test
12V
5V
3.3V
5VSB
DC/AC (Watts)
Efficiency
Fan Speed (RPM)
PSU Noise (dB[A])
Temps (In/Out)
PF/AC Volts
10%
6.444A
1.983A
2.004A
0.986A
100.007
85.196%
0
<6.0
44.42°C
0.968
12.166V
5.044V
3.294V
5.072V
117.382
40.14°C
115.07V
20%
13.896A
2.976A
3.008A
1.185A
199.953
89.368%
0
<6.0
45.69°C
0.978
12.165V
5.042V
3.292V
5.062V
223.739
40.79°C
115.04V
30%
21.732A
3.472A
3.51A
1.363A
299.997
91.261%
0
<6.0
46.34°C
0.982
12.145V
5.041V
3.291V
5.137V
328.725
41.12°C
115.01V
40%
29.533A
3.969A
4.013A
1.559A
399.475
91.237%
501
7.8
41.2°C
0.984
12.131V
5.04V
3.29V
5.132V
437.845
47.21°C
114.98V
50%
37.036A
4.964A
5.02A
1.756A
499.183
90.879%
634
14.4
42.41°C
0.985
12.114V
5.037V
3.287V
5.124V
549.286
48.89°C
114.95V
60%
44.629A
5.96A
6.028A
1.955A
599.702
90.336%
816
22.8
42.51°C
0.987
12.097V
5.035V
3.285V
5.117V
663.864
49.64°C
114.92V
70%
52.181A
6.955A
7.036A
2.153A
699.427
89.69%
1046
30.0
43.11°C
0.988
12.080V
5.033V
3.284V
5.109V
779.832
50.92°C
114.88V
80%
59.805A
7.952A
8.039A
2.254A
799.414
88.916%
1396
39.0
43.79°C
0.99
12.064V
5.032V
3.282V
5.102V
899.07
52.51°C
114.85V
90%
67.766A
8.449A
8.532A
2.355A
899.19
88.101%
1752
46.4
44.89°C
0.991
12.053V
5.03V
3.28V
5.096V
1020.635
54.29°C
114.81V
100%
75.483A
8.951A
9.055A
2.952A
999.205
87.147%
2087
50.8
46.06°C
0.992
12.050V
5.027V
3.278V
5.08V
1146.584
55.95°C
114.76V
110%
83.133A
9.95A
10.16A
2.956A
1099.781
86.233%
2132
50.9
47.28°C
0.993
12.047V
5.025V
3.276V
5.075V
1275.365
58.18°C
114.73V
CL1
0.115A
14.307A
14.486A
0A
121.274
82.665%
637
14.4
43.3°C
0.971
12.162V
5.046V
3.292V
5.079V
146.707
45.61°C
115.06V
CL2
0.113A
21.743A
0A
0A
111.376
80.566%
502
7.8
42.18°C
0.969
12.170V
5.059V
3.295V
5.085V
138.242
44.89°C
115.06V
CL3
0.113A
0A
22.003A
0A
73.966
75.612%
404
<6.0
41.07°C
0.96
12.170V
5.052V
3.299V
5.079V
97.824
44.4°C
115.07V
CL4
82.973A
0A
0A
0A
999.939
87.487%
2129
50.9
45.28°C
0.992
12.051V
5.042V
3.287V
5.138V
1142.958
47.04°C
114.77V
The results above are not used in the certification process
Light Load Tests 115V
Test
12V
5V
3.3V
5VSB
DC/AC (Watts)
Efficiency
Fan Speed (RPM)
PSU Noise (dB[A])
Temps (In/Out)
PF/AC Volts
20W
1.232A
0.494A
0.499A
0.196A
19.994
78.644%
0
<6.0
40.18°C
0.86
12.044V
5.062V
3.303V
5.091V
25.423
37.07°C
115.09V
40W
2.714A
0.691A
0.699A
0.295A
39.991
83.944%
0
<6.0
41.31°C
0.917
12.042V
5.062V
3.304V
5.088V
47.64
37.92°C
115.08V
60W
4.194A
0.891A
0.901A
0.393A
59.991
86.084%
0
<6.0
42.41°C
0.949
12.046V
5.052V
3.298V
5.085V
69.686
38.75°C
115.08V
80W
5.673A
1.09A
1.102A
0.492A
79.957
87.538%
0
<6.0
43.62°C
0.951
12.044V
5.047V
3.295V
5.082V
91.338
39.63°C
115.07V
The results above are not used in the certification process
Ripple Measurements 115V
Test
12V
5V
3.3V
5VSB
Pass/Fail
10% Load
7.85mV
10.97mV
6.27mV
9.87mV
Pass
20% Load
9.01mV
11.48mV
7.38mV
9.87mV
Pass
30% Load
15.06mV
10.67mV
8.75mV
10.12mV
Pass
40% Load
13.54mV
10.82mV
8.19mV
11.23mV
Pass
50% Load
11.65mV
10.72mV
8.34mV
10.47mV
Pass
60% Load
11.44mV
13.11mV
16.63mV
10.57mV
Pass
70% Load
12.78mV
10.77mV
9.81mV
11.54mV
Pass
80% Load
12.41mV
11.48mV
11.33mV
11.64mV
Pass
90% Load
12.15mV
11.18mV
11.37mV
11.59mV
Pass
100% Load
18.05mV
6.36mV
12.21mV
12.95mV
Pass
110% Load
18.43mV
6.54mV
13.22mV
13.09mV
Pass
Crossload1
7.37mV
5.80mV
10.52mV
13.75mV
Pass
Crossload2
9.31mV
6.61mV
7.68mV
13.00mV
Pass
Crossload3
9.77mV
10.11mV
12.84mV
13.51mV
Pass
Crossload4
16.76mV
5.13mV
10.04mV
14.30mV
Pass
The results above are not used in the certification process
Gamer Storm PX1000G
Top side
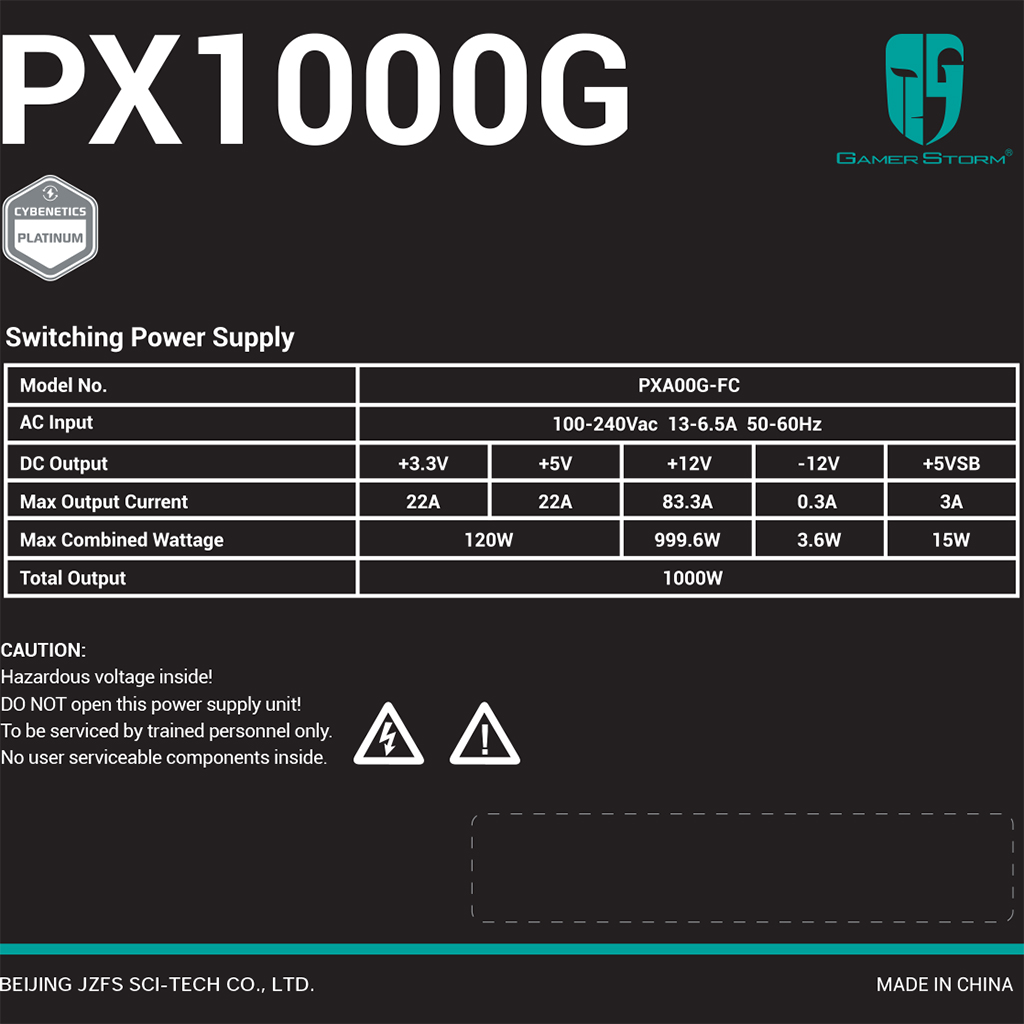
Power specifications label
All data and graphs included in this test report can be used by any individual on the following conditions: › It should be mentioned that the test results are provided by Cybenetics › The link to the original test results document should be provided in any case
Cybenetics offers the ETA and Lambda voluntary certification programs, through which the efficient and silent power supplies are promoted