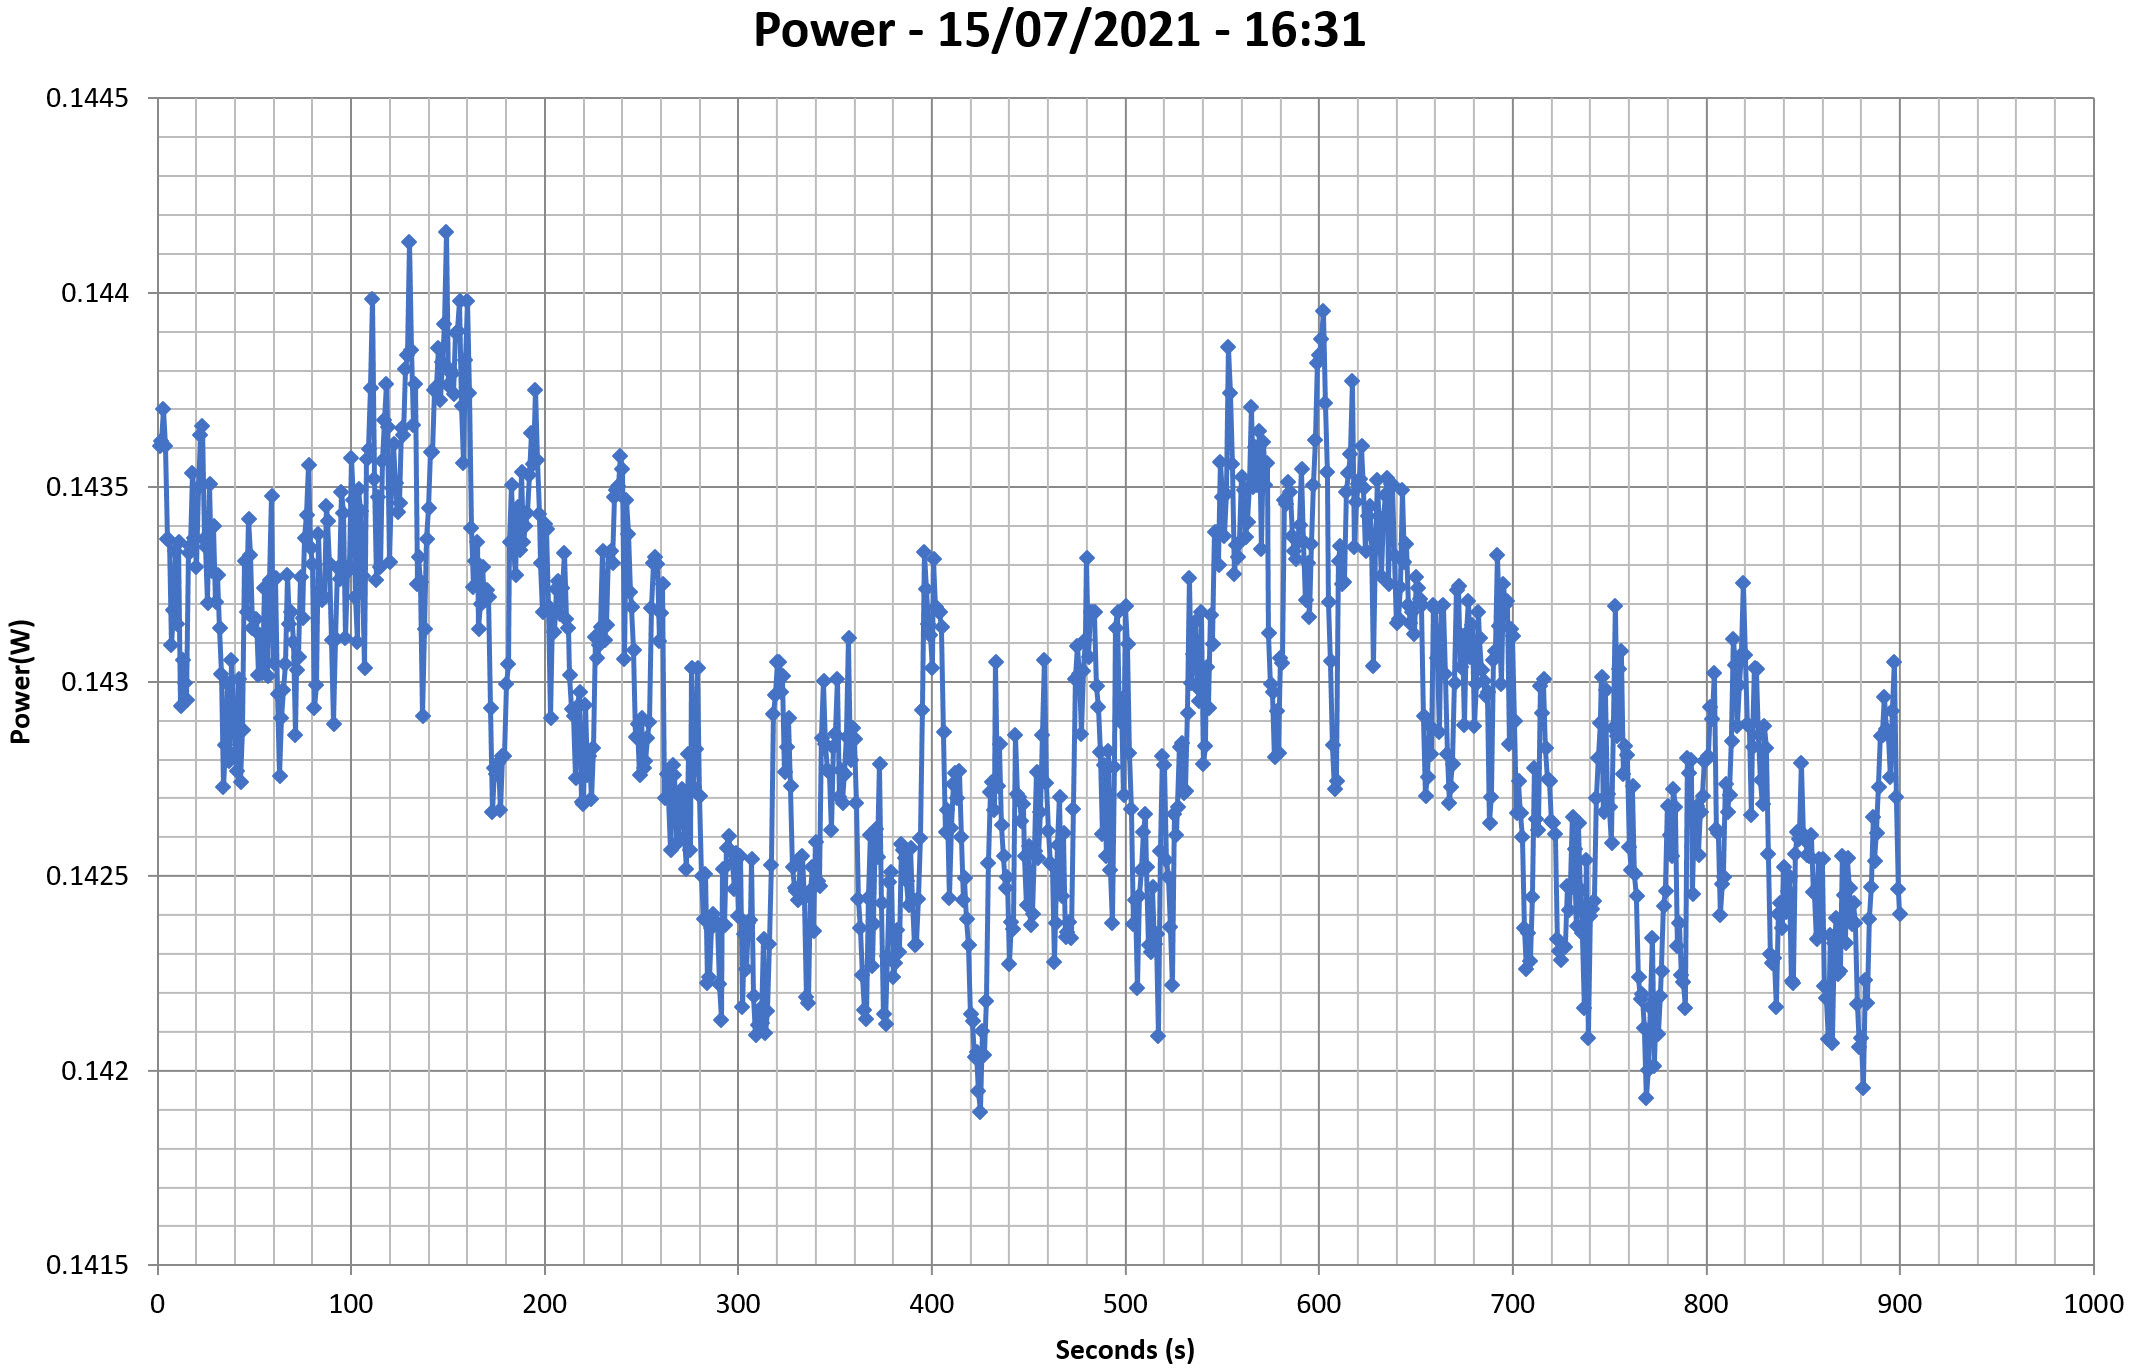
This graph is generated by the PPA Standby Power Analysis software which takes full control of the power analyzer during the whole procedure. This application features all of the EN50564 & IEC62301 test limits for standby power software testing
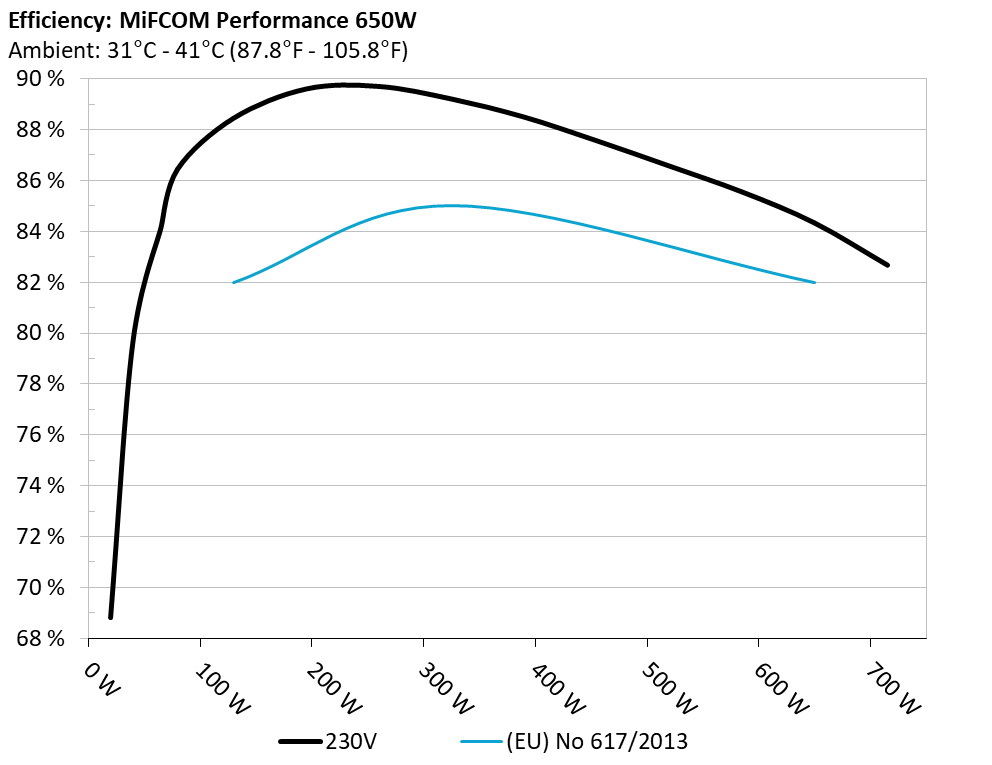
Efficiency Graph
230V
INFO
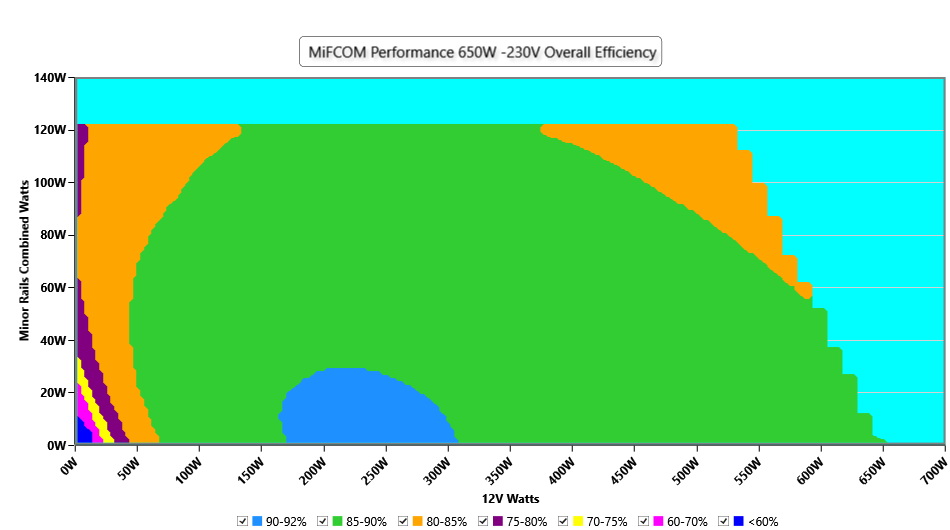
This graph depicts the PSU`s efficiency throughout its entire operational range. For the generation of the efficiency and noise graphs we set our loaders to auto mode through our custom-made software before trying thousands of possible load combinations
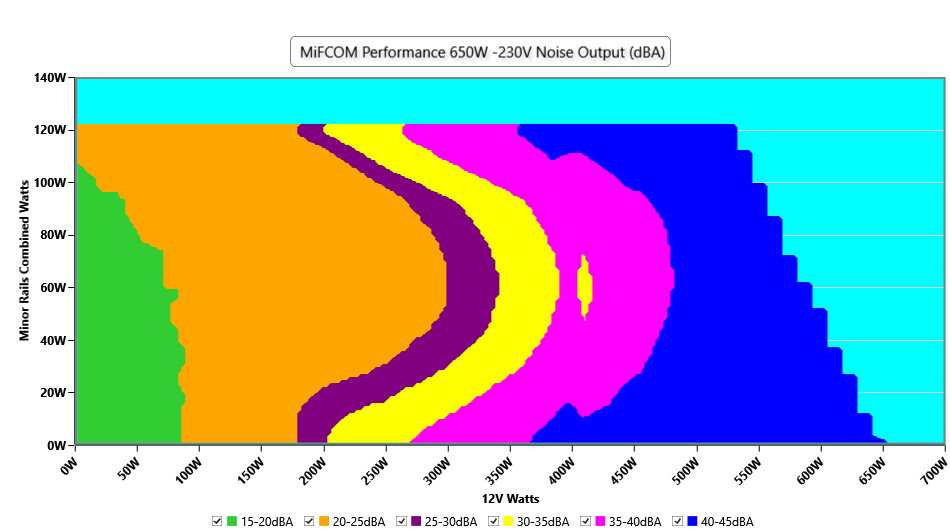
Noise Graph
230V
INFO
The PSU`s noise in its entire operational range and under 30-32 °C ambient is depicted in this graph. The X axis represents the load on the +12V rail(s) while the Y axis is the load on the minor rails
Indicative Performance
Efficiency under high ambient temperature
INFO
The PSU`s efficiency under high ambient temperatures with 115V and 230V input. For this graph the results of the 10-110% load regulation table are used
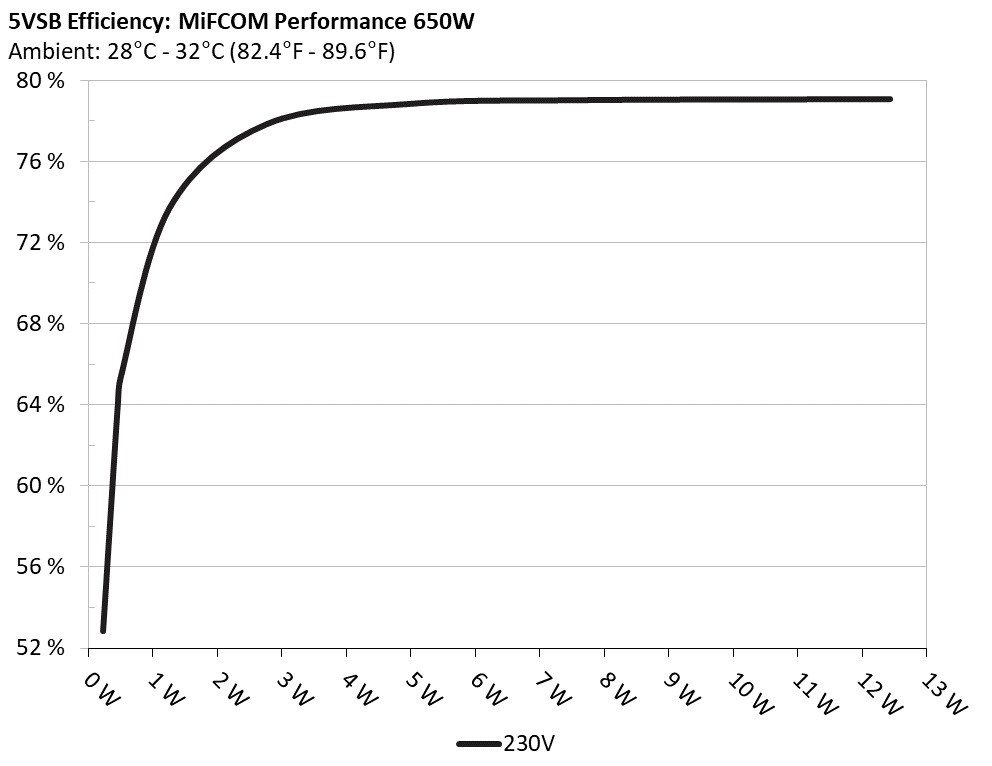
5VSB Efficiency
INFO
This graph depicts the efficiency levels of the 5VSB rail with 115V and 230V input
5VSB Efficiency (ERP LOT 3/6 & CEC) 230V
Test #
5VSB
DC/AC (Watts)
Efficiency
PF/AC Volts
1
0.045A
0.227W
52.846%
0.014
5.044V
0.43W
230.29V
2
0.09A
0.454W
63.954%
0.023
5.043V
0.71W
230.29V
3
0.55A
2.767W
77.85%
0.108
5.029V
3.554W
230.29V
4
1A
5.017W
78.853%
0.176
5.016V
6.362W
230.29V
5
1.5A
7.503W
79.028%
0.233
5.001V
9.494W
230.29V
6
2.501A
12.431W
79.081%
0.304
4.971V
15.719W
230.29V
Supplementary Tests (For Reference)
Typical Load Tests 230V
Test
12V
5V
3.3V
5VSB
DC/AC (Watts)
Efficiency
Fan Speed (RPM)
PSU Noise (dB[A])
Temps (In/Out)
PF/AC Volts
10%
3.570A
1.922A
1.972A
1A
65.017
83.975%
674
19.3
34.21°C
0.846
12.160V
5.202V
3.347V
5V
77.424
39.21°C
230.28V
20%
8.174A
2.892A
2.973A
1.205A
129.974
88.438%
677
19.6
34.91°C
0.921
12.121V
5.187V
3.331V
4.979V
146.967
40.48°C
230.28V
30%
13.155A
3.383A
3.483A
1.412A
194.985
89.592%
679
19.6
35.02°C
0.955
12.081V
5.173V
3.316V
4.959V
217.636
41.29°C
230.28V
40%
18.176A
3.876A
3.998A
1.62A
260.083
89.692%
851
25.8
35.56°C
0.966
12.042V
5.161V
3.302V
4.939V
289.975
42.47°C
230.28V
50%
22.877A
4.861A
5.024A
1.831A
325.088
89.199%
1092
32.7
36.29°C
0.975
12.002V
5.145V
3.284V
4.917V
364.453
43.53°C
230.28V
60%
27.584A
5.851A
6.062A
2A
389.49
88.495%
1347
38.6
36.76°C
0.978
11.959V
5.129V
3.267V
4.895V
440.125
44.3°C
230.28V
70%
32.389A
6.848A
7.112A
2.26A
455.027
87.558%
1507
41.6
37.1°C
0.981
11.915V
5.113V
3.249V
4.87V
519.687
45.08°C
230.28V
80%
37.230A
7.851A
8.173A
2.373A
519.856
86.567%
1511
41.6
37.98°C
0.984
11.870V
5.098V
3.23V
4.849V
600.524
46.53°C
230.29V
90%
42.517A
8.364A
8.713A
2.486A
585.255
85.544%
1511
41.6
38.76°C
0.986
11.824V
5.084V
3.214V
4.829V
684.159
47.83°C
230.29V
100%
47.787A
8.88A
9.29A
2.6A
649.986
84.328%
1510
41.6
39.64°C
0.988
11.777V
5.07V
3.197V
4.809V
770.783
49.52°C
230.29V
110%
52.830A
9.894A
10.474A
2.61A
715.407
82.666%
1509
41.6
41.33°C
0.989
11.728V
5.056V
3.179V
4.791V
865.424
52.17°C
230.29V
CL1
0.116A
13.959A
14.474A
0.001A
121.347
78.178%
1503
41.5
36.49°C
0.93
12.157V
5.174V
3.296V
4.976V
155.218
43.27°C
230.29V
CL2
0.115A
19.266A
0A
0.002A
101.457
76.64%
1095
32.7
37.26°C
0.916
12.148V
5.193V
3.326V
5.004V
132.381
44.53°C
230.3V
CL3
0.115A
0A
19.921A
0.001A
67.402
71.114%
1111
33.2
38.4°C
0.878
12.184V
5.193V
3.313V
4.996V
94.783
47.38°C
230.3V
CL4
55.214A
0A
0A
0.001A
649.859
85.865%
1515
41.6
39.31°C
0.988
11.770V
5.107V
3.244V
4.933V
756.84
48.81°C
230.29V
The results above are not used in the certification process
Light Load Tests 230V
Test
12V
5V
3.3V
5VSB
DC/AC (Watts)
Efficiency
Fan Speed (RPM)
PSU Noise (dB[A])
Temps (In/Out)
PF/AC Volts
20W
1.220A
0.479A
0.491A
0.199A
20.01
68.814%
669
18.9
30.97°C
0.583
12.185V
5.215V
3.362V
5.036V
29.078
34.25°C
230.27V
40W
2.686A
0.672A
0.688A
0.298A
40.011
79.662%
672
19.2
32°C
0.754
12.170V
5.21V
3.357V
5.029V
50.227
35.85°C
230.27V
60W
4.156A
0.864A
0.886A
0.398A
60.012
84.129%
673
19.2
32.93°C
0.83
12.160V
5.206V
3.353V
5.022V
71.334
37.09°C
230.28V
80W
5.626A
1.057A
1.084A
0.499A
79.977
86.445%
674
19.3
33.33°C
0.874
12.149V
5.203V
3.348V
5.015V
92.517
37.97°C
230.28V
The results above are not used in the certification process
Ripple Measurements 230V
Test
12V
5V
3.3V
5VSB
Pass/Fail
10% Load
13.36mV
14.04mV
15.19mV
10.03mV
Pass
20% Load
14.02mV
12.56mV
16.11mV
10.75mV
Pass
30% Load
14.63mV
14.25mV
16.87mV
10.59mV
Pass
40% Load
16.63mV
13.38mV
18.67mV
10.80mV
Pass
50% Load
18.83mV
13.33mV
18.77mV
11.62mV
Pass
60% Load
24.05mV
16.39mV
18.61mV
12.18mV
Pass
70% Load
34.08mV
20.58mV
19.38mV
13.36mV
Pass
80% Load
47.69mV
24.26mV
22.55mV
14.33mV
Pass
90% Load
60.69mV
26.56mV
24.03mV
16.22mV
Pass
100% Load
71.13mV
31.03mV
26.77mV
24.06mV
Pass
110% Load
84.69mV
33.77mV
28.56mV
26.28mV
Pass
Crossload1
29.29mV
19.96mV
18.77mV
22.09mV
Pass
Crossload2
33.31mV
24.05mV
25.47mV
23.23mV
Pass
Crossload3
14.58mV
17.16mV
34.21mV
18.02mV
Pass
Crossload4
64.89mV
29.63mV
21.76mV
20.56mV
Pass
The results above are not used in the certification process
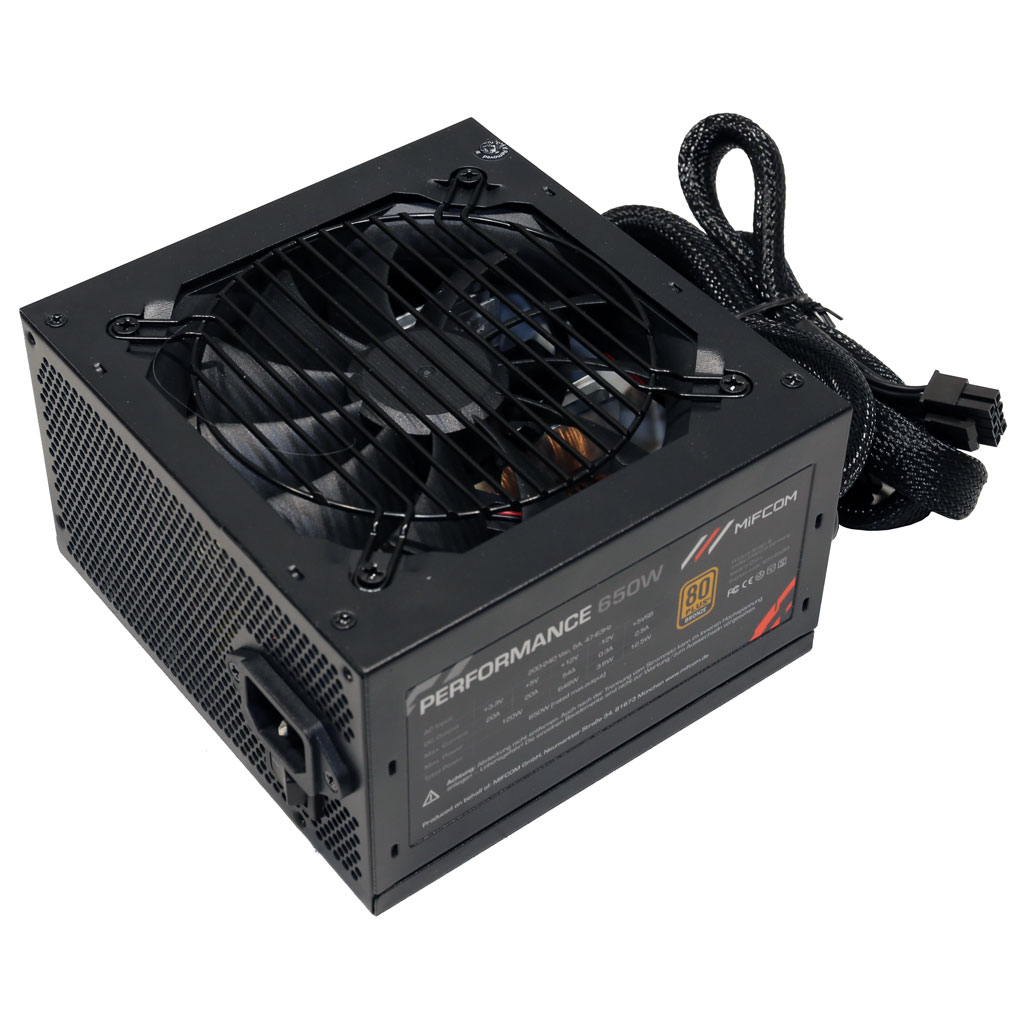
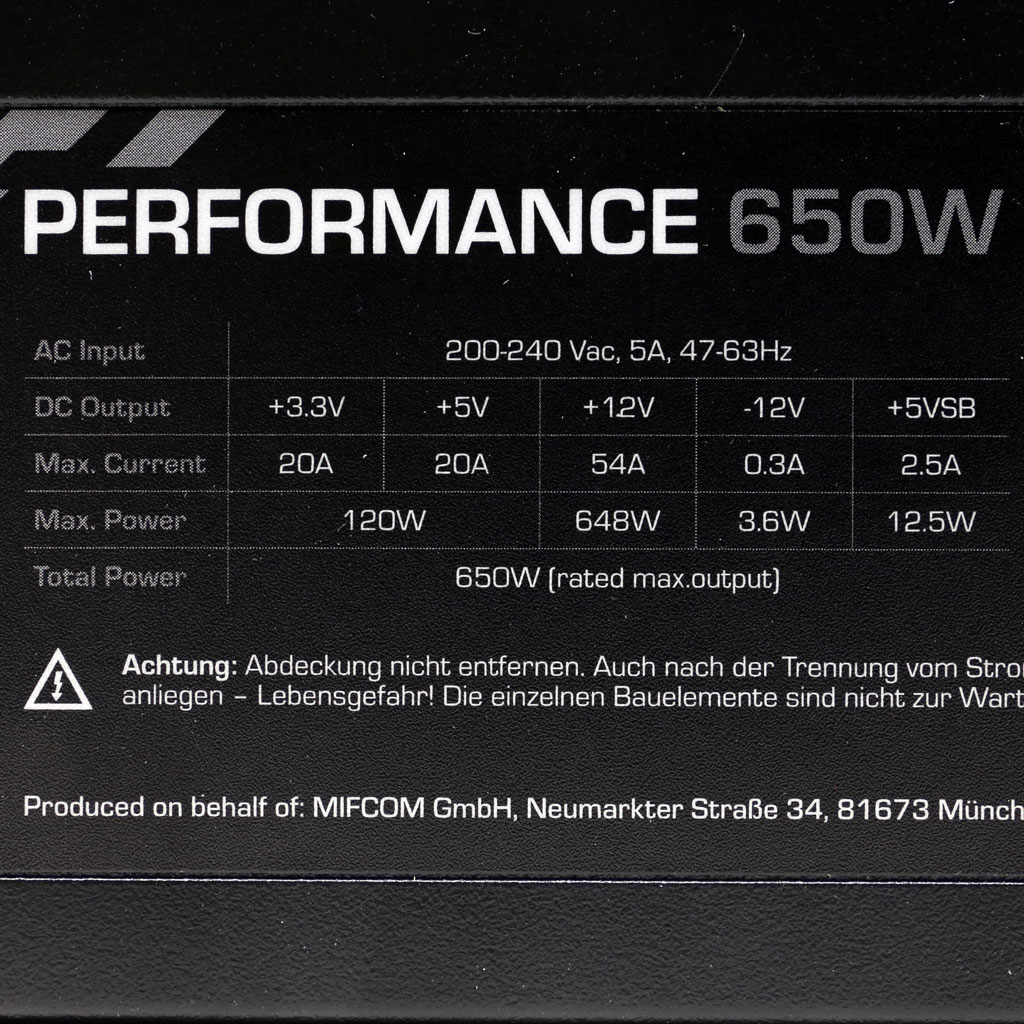
MiFCOM Performance 650W
Top side
Power specifications label
All data and graphs included in this test report can be used by any individual on the following conditions: › It should be mentioned that the test results are provided by Cybenetics › The link to the original test results document should be provided in any case
Cybenetics offers the ETA and Lambda voluntary certification programs, through which the efficient and silent power supplies are promoted