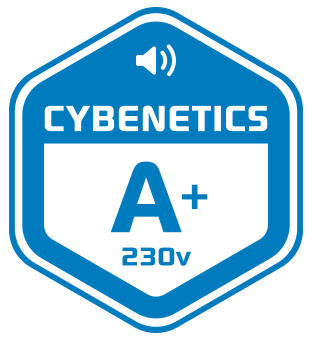
This graph is generated by the PPA Standby Power Analysis software which takes full control of the power analyzer during the whole procedure. This application features all of the EN50564 & IEC62301 test limits for standby power software testing
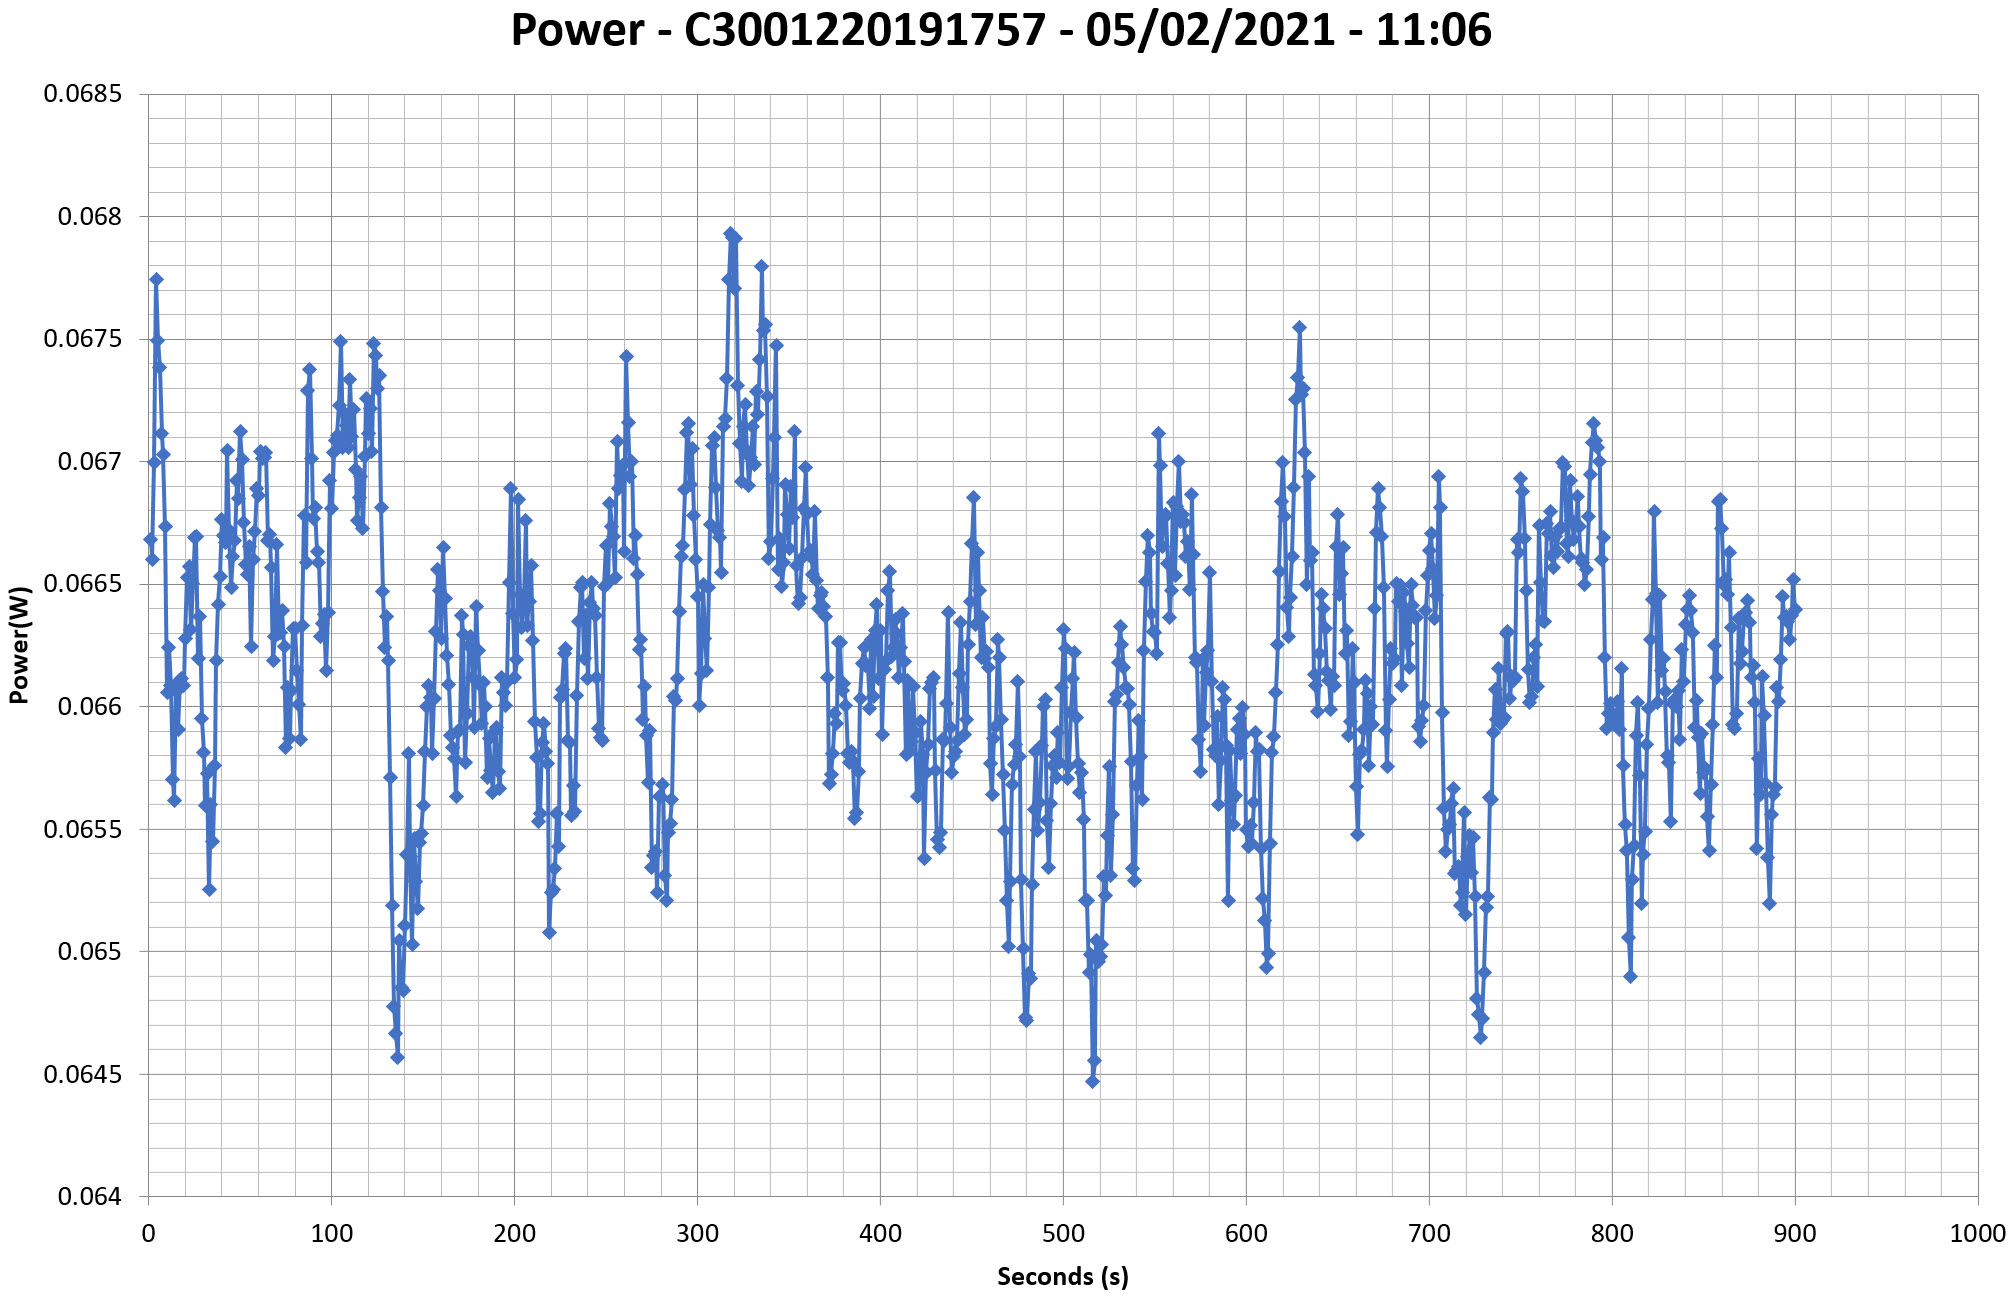
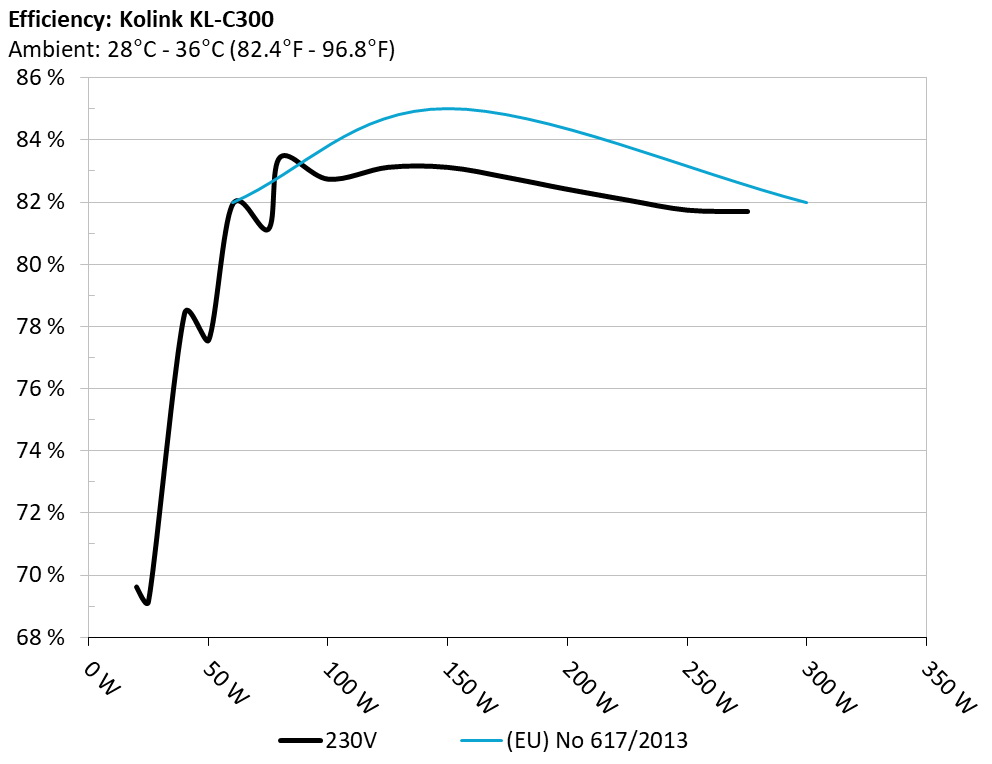
Efficiency Graph
230V
INFO
This graph depicts the PSU`s efficiency throughout its entire operational range. For the generation of the efficiency and noise graphs we set our loaders to auto mode through our custom-made software before trying thousands of possible load combinations
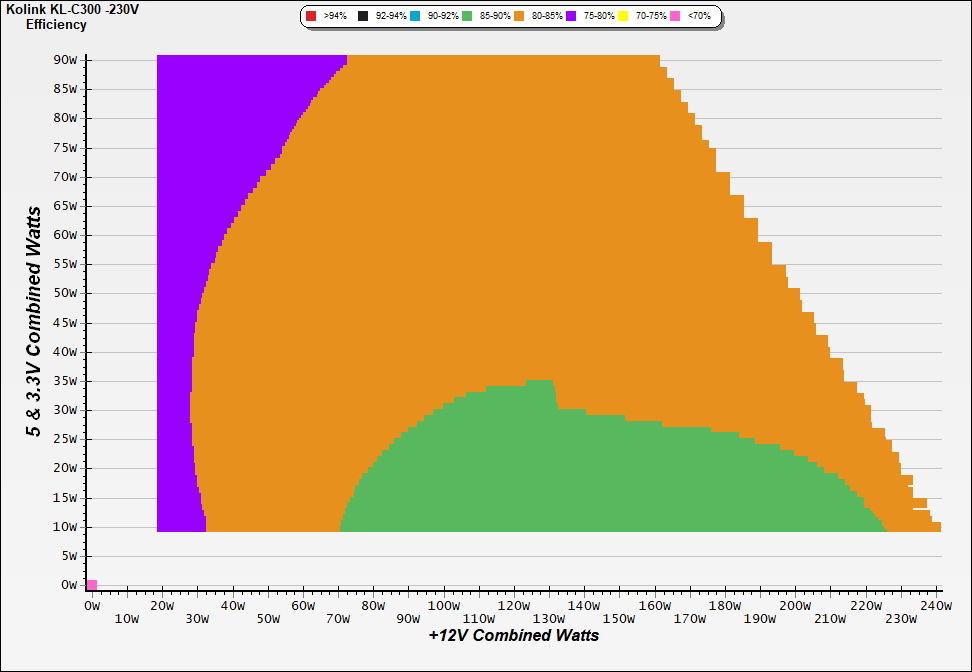
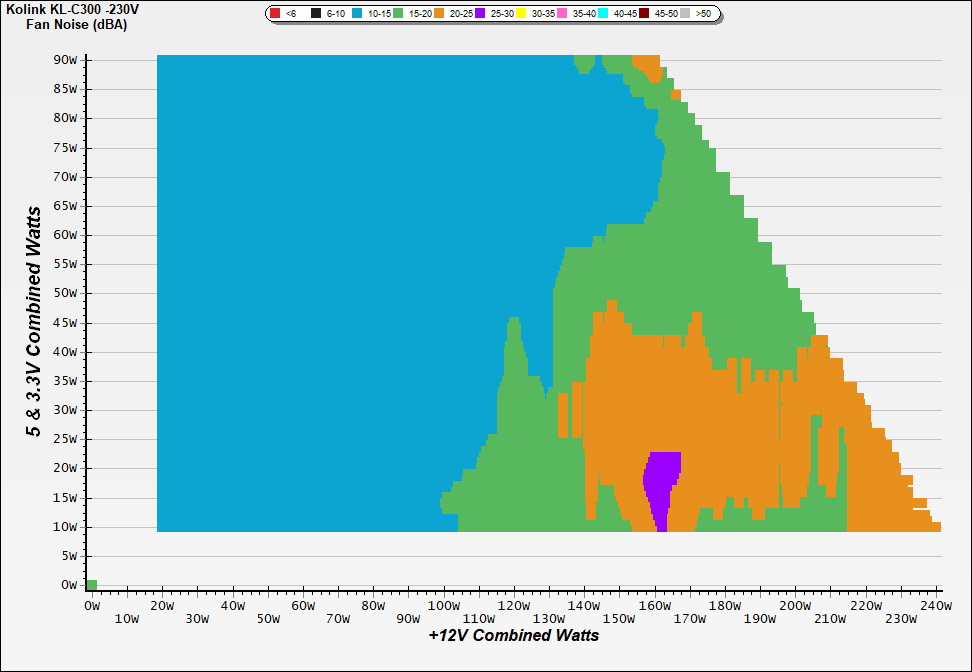
Noise Graph
230V
INFO
The PSU`s noise in its entire operational range and under 30-32 °C ambient is depicted in this graph. The X axis represents the load on the +12V rail(s) while the Y axis is the load on the minor rails
Indicative Performance
Efficiency under high ambient temperature
INFO
The PSU`s efficiency under high ambient temperatures with 115V and 230V input. For this graph the results of the 10-110% load regulation table are used
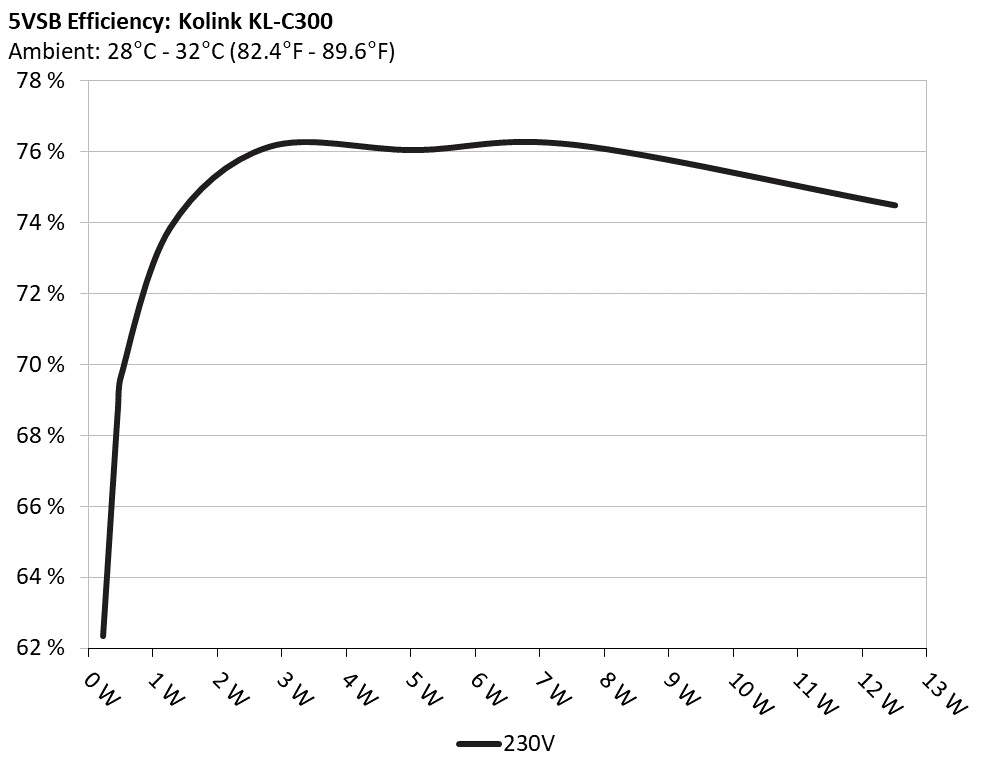
5VSB Efficiency
INFO
This graph depicts the efficiency levels of the 5VSB rail with 115V and 230V input
5VSB Efficiency (ERP LOT 3/6 & CEC) 230V
Test #
5VSB
DC/AC (Watts)
Efficiency
PF/AC Volts
1
0.045A
0.230
62.331%
0.024
5.100V
0.369
230.33V
2
0.090A
0.459
68.713%
0.043
5.098V
0.668
230.33V
3
0.550A
2.794
76.110%
0.194
5.079V
3.671
230.35V
4
1.000A
5.061
76.025%
0.278
5.060V
6.657
230.33V
5
1.500A
7.564
76.166%
0.332
5.041V
9.931
230.33V
6
2.500A
12.506
74.467%
0.388
5.002V
16.794
230.31V
Supplementary Tests (For Reference)
Typical Load Tests 230V
Test #
12V
5V
3.3V
5VSB
DC/AC (Watts)
Efficiency
Fan Speed (RPM)
PSU Noise (dB[A])
Temps (In/Out)
PF/AC Volts
1
0.261A
2.058A
1.951A
0.992A
24.960
69.157%
664
13.3
30.77°C
0.820
12.853V
4.862V
3.381V
5.044V
36.092
34.29°C
230.31V
2
1.551A
3.017A
2.938A
1.195A
50.021
77.548%
677
14.0
30.82°C
0.897
12.328V
4.973V
3.368V
5.023V
64.503
34.88°C
230.30V
3
3.176A
3.522A
3.442A
1.399A
75.011
81.117%
683
13.6
31.00°C
0.923
12.265V
4.970V
3.356V
5.005V
92.473
35.77°C
230.30V
4
4.804A
4.036A
3.945A
1.605A
100.001
82.725%
695
14.0
31.45°C
0.941
12.237V
4.958V
3.346V
4.987V
120.883
37.19°C
230.25V
5
6.082A
5.075A
4.953A
1.813A
124.989
83.106%
708
14.6
32.37°C
0.952
12.245V
4.928V
3.332V
4.965V
150.397
38.58°C
230.27V
6
7.367A
6.126A
5.968A
2.000A
149.940
83.105%
705
14.8
32.54°C
0.957
12.251V
4.898V
3.317V
4.943V
180.423
39.66°C
230.28V
7
8.635A
7.199A
6.995A
2.236A
174.995
82.776%
707
14.6
33.41°C
0.962
12.262V
4.864V
3.302V
4.919V
211.407
41.16°C
230.28V
8
9.917A
8.002A
8.028A
2.451A
198.722
82.416%
893
19.6
33.70°C
0.966
12.263V
4.838V
3.288V
4.896V
241.121
42.34°C
230.28V
9
11.621A
8.835A
8.549A
2.458A
224.953
82.053%
1056
24.3
34.93°C
0.968
12.258V
4.811V
3.275V
4.882V
274.156
44.25°C
230.30V
10
13.297A
9.399A
9.102A
2.570A
250.017
81.728%
1280
31.2
35.07°C
0.970
12.245V
4.788V
3.262V
4.865V
305.915
45.15°C
230.30V
11
15.394A
9.410A
9.130A
2.575A
275.062
81.686%
1341
32.1
35.52°C
0.972
12.203V
4.783V
3.253V
4.855V
336.730
46.26°C
230.31V
CL1
5.767A
10.999A
10.997A
0.001A
160.378
80.419%
715
15.2
32.56°C
0.961
12.489V
4.745V
3.288V
4.990V
199.427
38.64°C
230.28V
CL2
20.002A
1.002A
1.000A
1.000A
245.249
84.689%
1026
23.8
35.35°C
0.970
11.592V
5.090V
3.313V
4.973V
289.588
44.88°C
230.29V
The results above are not used in the certification process
Light Load Tests 230V
Test #
12V
5V
3.3V
5VSB
DC/AC (Watts)
Efficiency
Fan Speed (RPM)
PSU Noise (dB[A])
PF/AC Volts
1
1.237A
0.488A
0.485A
0.197A
19.983
69.620%
685
13.8
0.775
11.998V
5.112V
3.392V
5.086V
28.703
230.31V
2
2.467A
0.983A
0.973A
0.395A
39.975
78.401%
687
13.8
0.871
12.031V
5.086V
3.383V
5.069V
50.988
230.29V
3
3.695A
1.481A
1.467A
0.594A
60.006
81.907%
687
13.8
0.907
12.059V
5.062V
3.374V
5.053V
73.261
230.21V
4
4.912A
1.985A
1.963A
0.794A
79.956
83.438%
688
13.8
0.925
12.083V
5.038V
3.365V
5.036V
95.827
230.27V
The results above are not used in the certification process
Ripple Measurements 230V
Test
12V
5V
3.3V
5VSB
Pass/Fail
10% Load
7.00mV
19.50mV
7.60mV
12.90mV
Pass
20% Load
7.40mV
28.00mV
10.50mV
15.80mV
Pass
30% Load
8.60mV
28.90mV
11.10mV
13.90mV
Pass
40% Load
8.10mV
28.00mV
11.40mV
13.00mV
Pass
50% Load
8.00mV
28.50mV
12.10mV
22.10mV
Pass
60% Load
8.40mV
29.40mV
12.30mV
13.90mV
Pass
70% Load
10.00mV
30.40mV
13.60mV
15.30mV
Pass
80% Load
9.30mV
30.00mV
23.00mV
16.30mV
Pass
90% Load
9.90mV
31.40mV
23.00mV
17.30mV
Pass
100% Load
14.50mV
36.00mV
25.70mV
18.90mV
Pass
110% Load
15.40mV
36.30mV
26.20mV
19.00mV
Pass
Crossload1
22.90mV
20.90mV
7.60mV
7.30mV
Pass
Crossload2
17.50mV
21.60mV
12.40mV
15.70mV
Pass
The results above are not used in the certification process
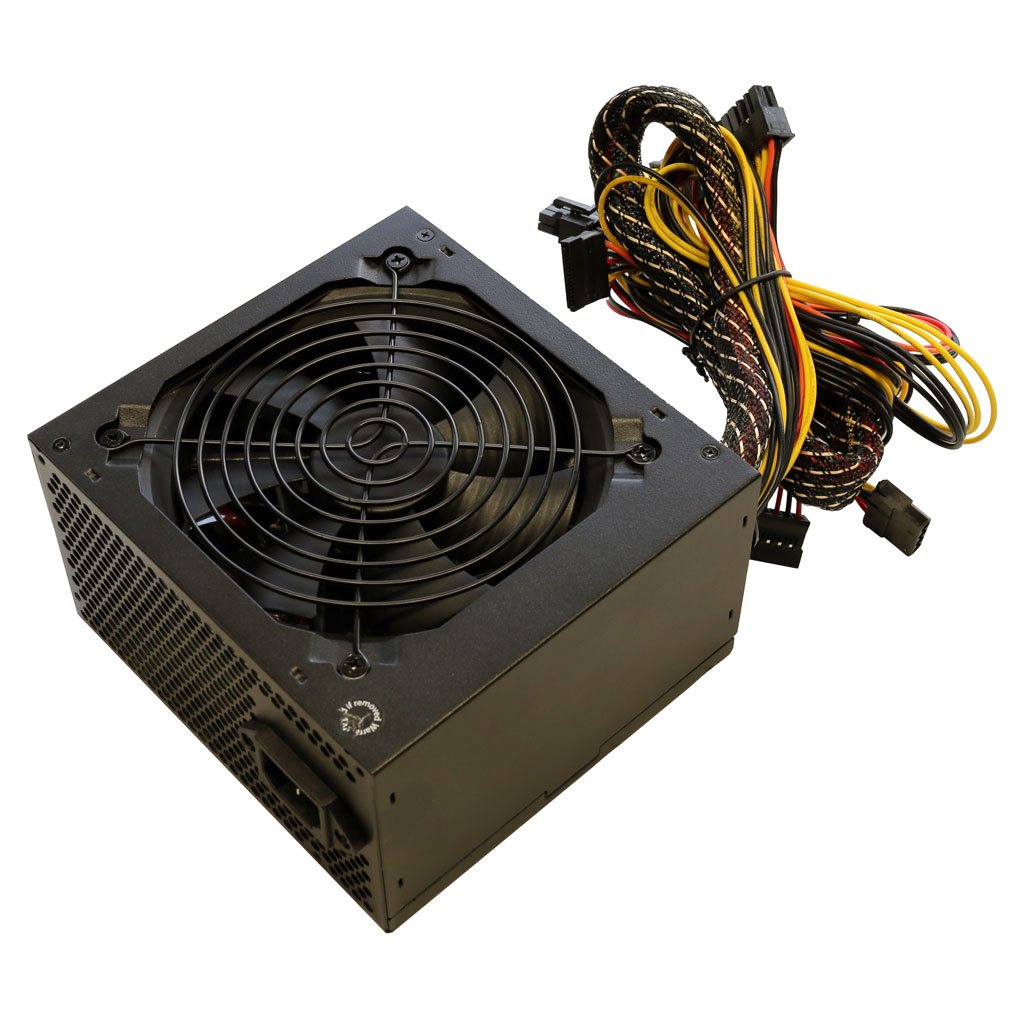
Kolink Core 300W
Top side
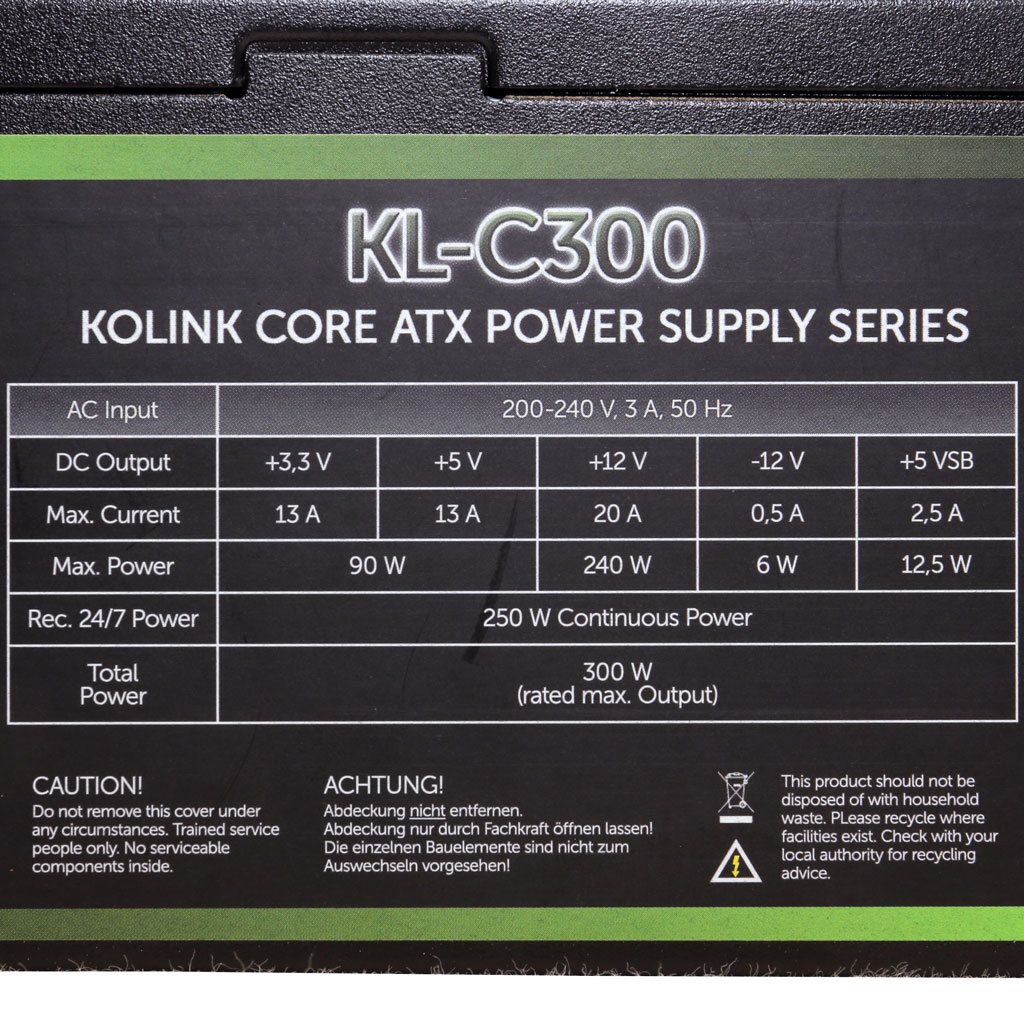
Power specifications label
All data and graphs included in this test report can be used by any individual on the following conditions: › It should be mentioned that the test results are provided by Cybenetics › The link to the original test results document should be provided in any case
Cybenetics offers the ETA and Lambda voluntary certification programs, through which the efficient and silent power supplies are promoted