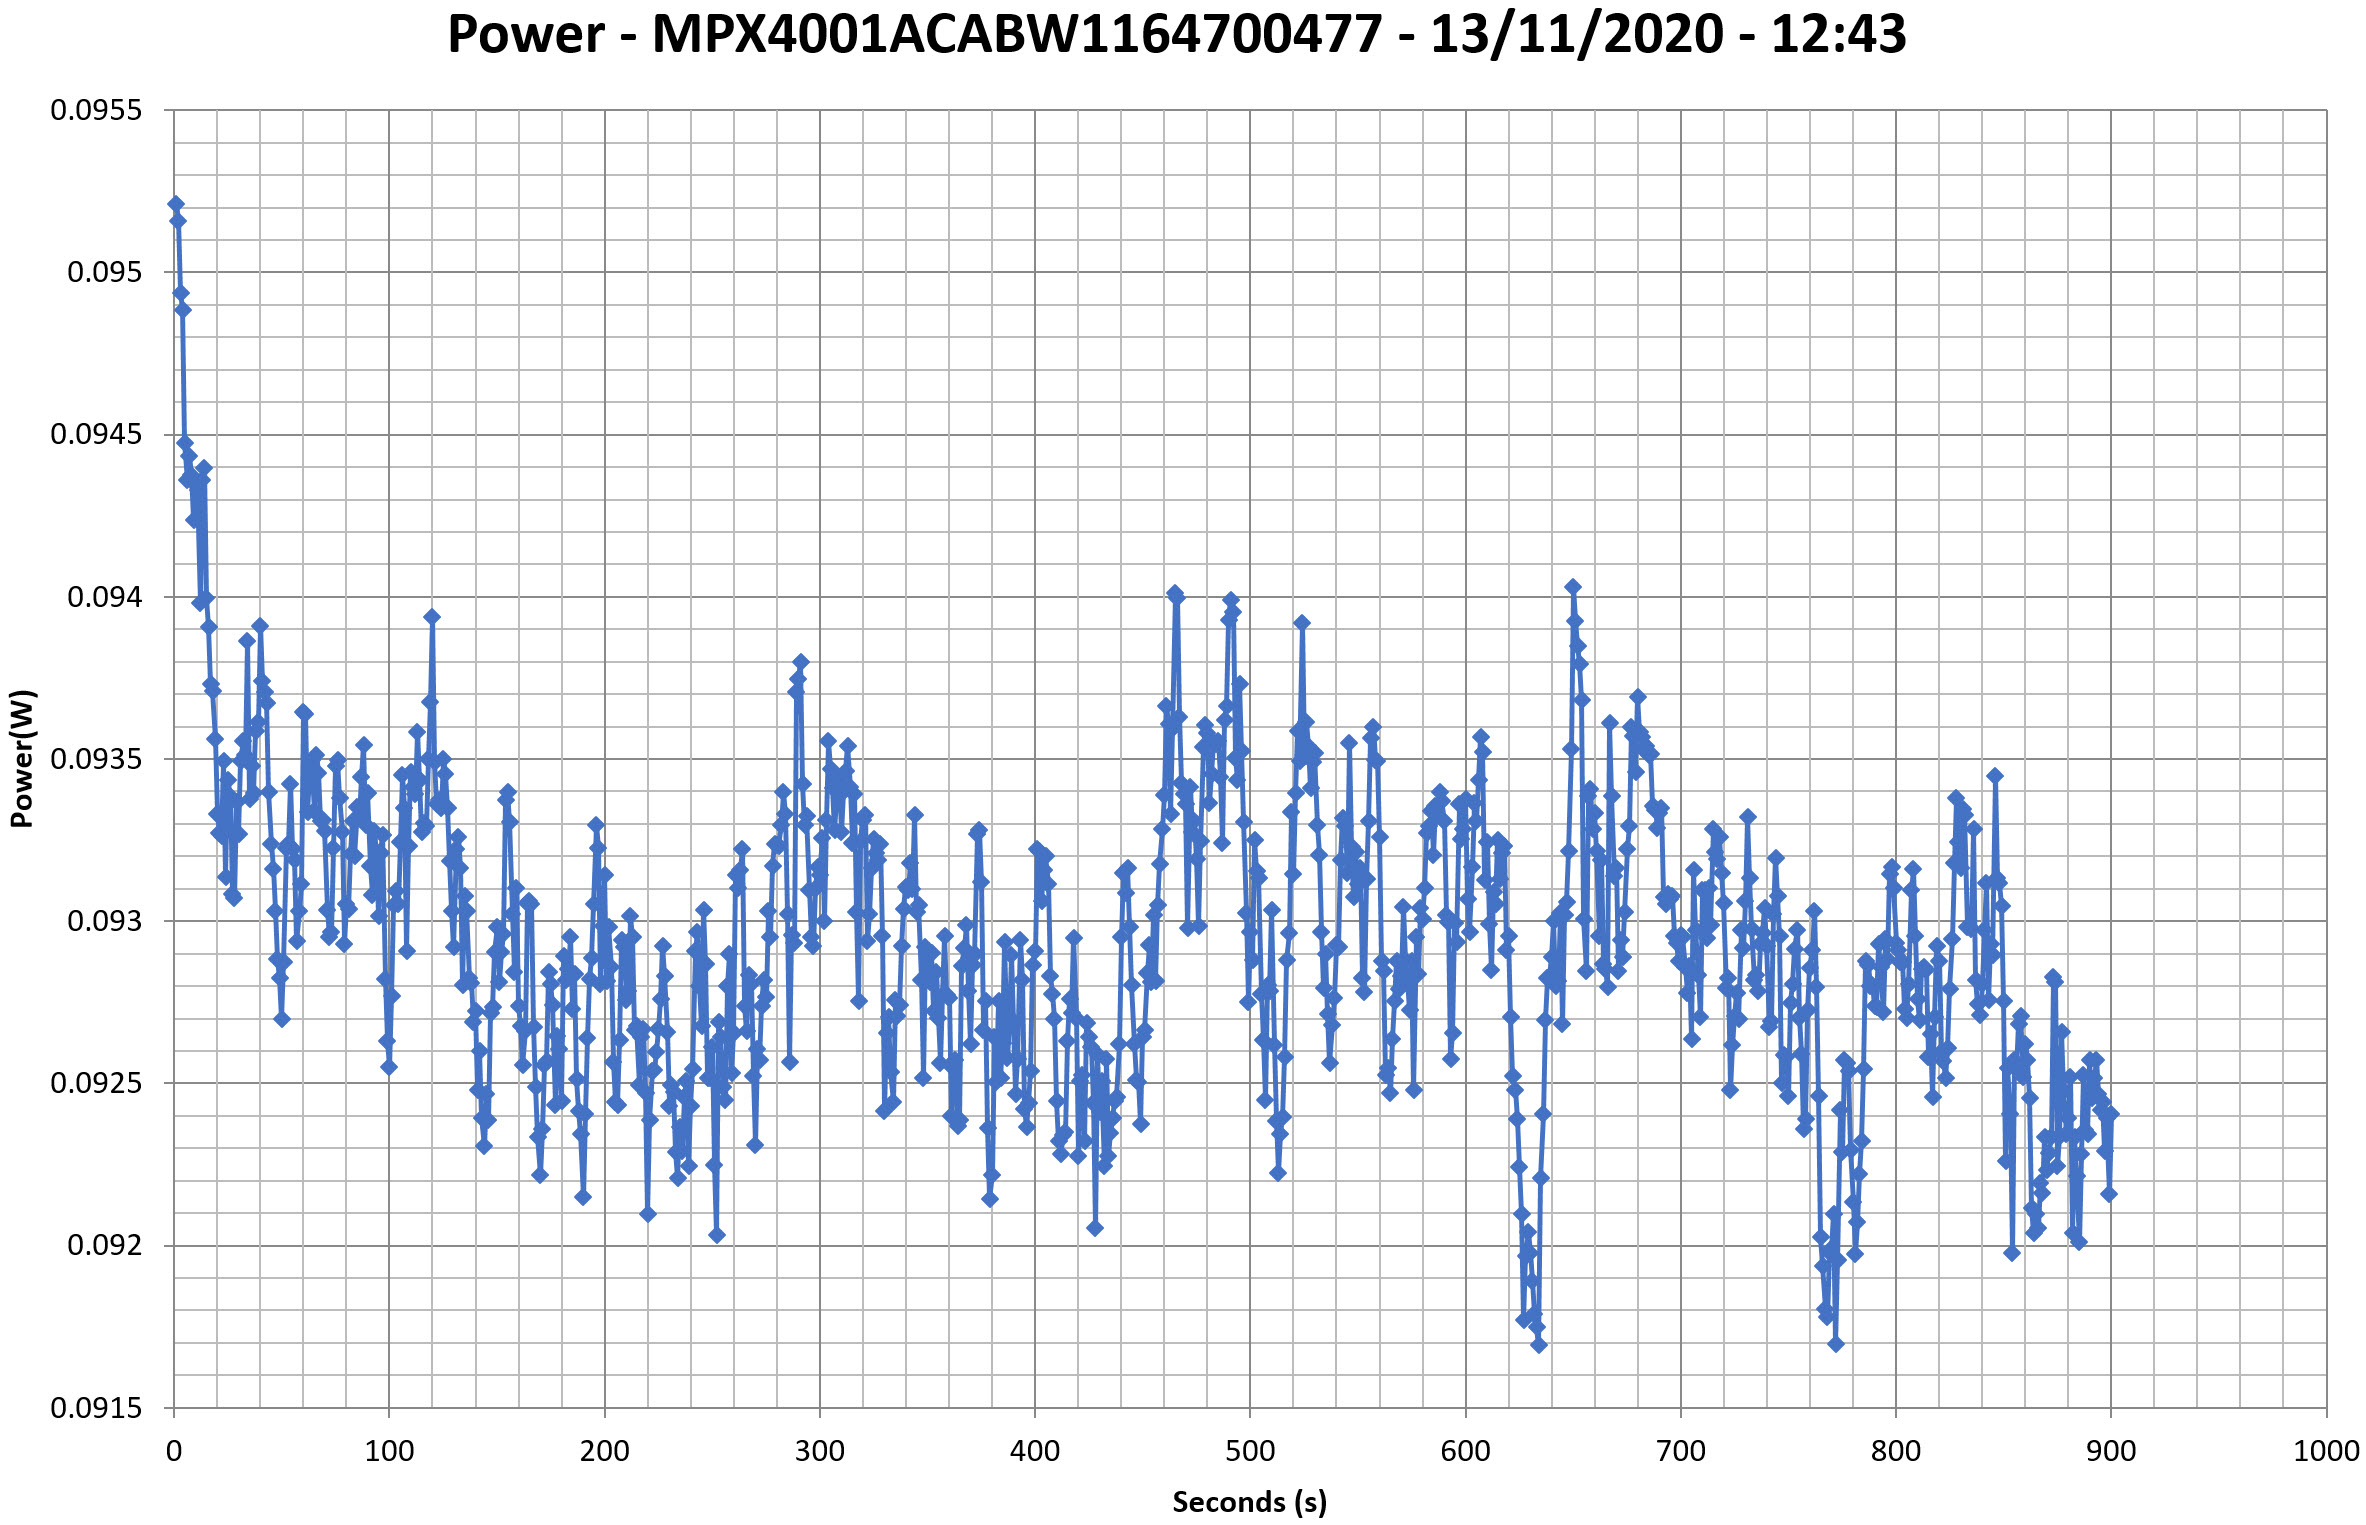
This graph is generated by the PPA Standby Power Analysis software which takes full control of the power analyzer during the whole procedure. This application features all of the EN50564 & IEC62301 test limits for standby power software testing
Efficiency Graph
230V
INFO
This graph depicts the PSU`s efficiency throughout its entire operational range. For the generation of the efficiency and noise graphs we set our loaders to auto mode through our custom-made software before trying thousands of possible load combinations
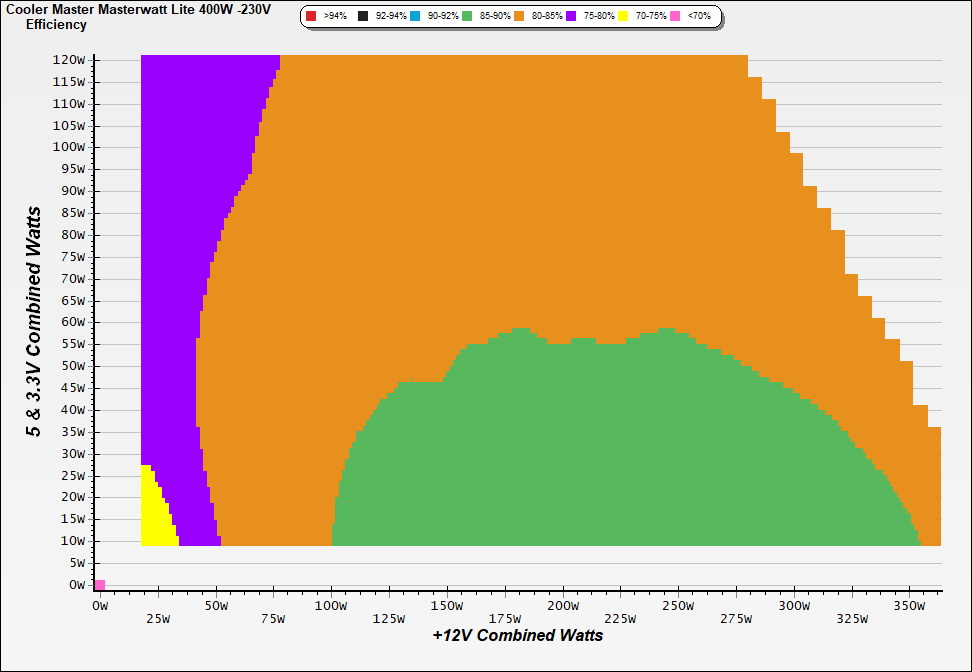
Noise Graph
230V
INFO
The PSU`s noise in its entire operational range and under 30-32 °C ambient is depicted in this graph. The X axis represents the load on the +12V rail(s) while the Y axis is the load on the minor rails
Indicative Performance
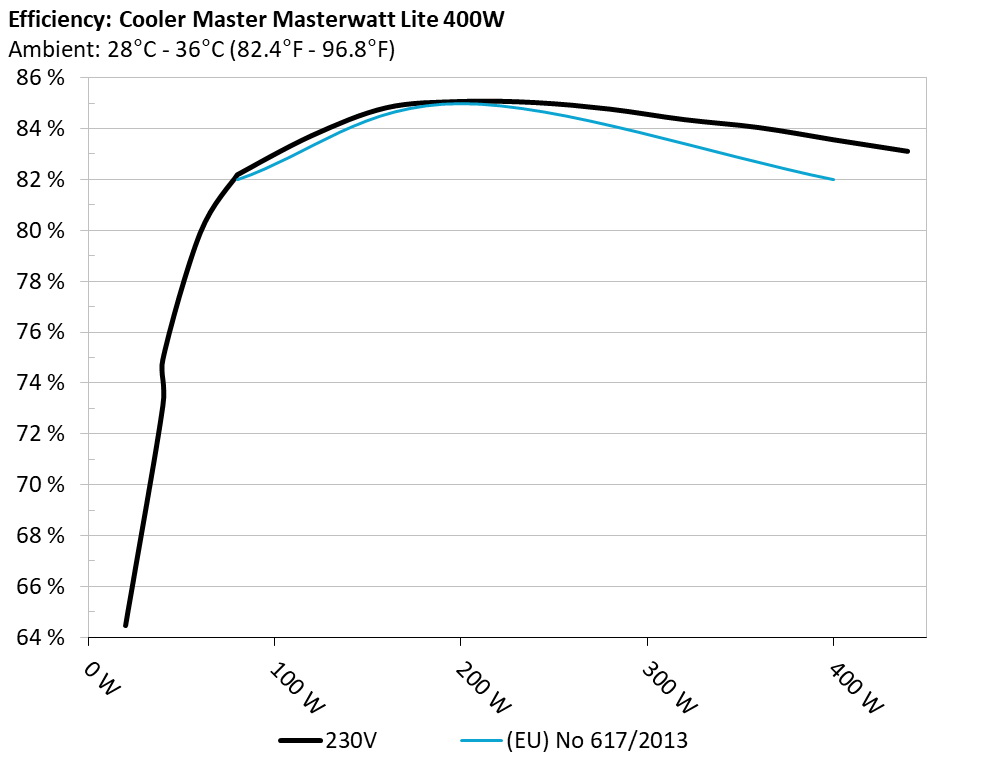
Efficiency under high ambient temperature
INFO
The PSU`s efficiency under high ambient temperatures with 115V and 230V input. For this graph the results of the 10-110% load regulation table are used
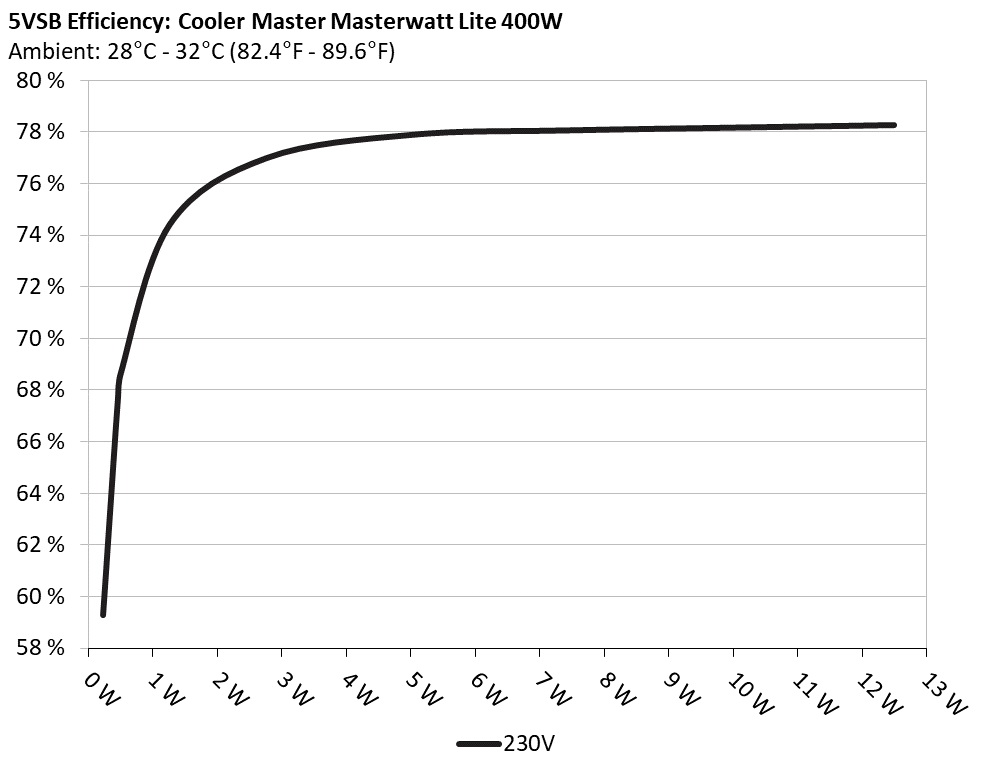
5VSB Efficiency
INFO
This graph depicts the efficiency levels of the 5VSB rail with 115V and 230V input
5VSB Efficiency (ERP LOT 3/6 & CEC) 230V
Test #
5VSB
DC/AC (Watts)
Efficiency
PF/AC Volts
1
0.045A
0.227
59.269%
0.025
5.041V
0.383
230.28V
2
0.090A
0.454
67.560%
0.043
5.041V
0.672
230.29V
3
0.550A
2.768
76.996%
0.189
5.033V
3.595
230.30V
4
1.000A
5.025
77.895%
0.268
5.025V
6.451
230.31V
5
1.500A
7.525
78.068%
0.317
5.017V
9.639
230.29V
6
2.500A
12.498
78.269%
0.365
5.000V
15.968
230.29V
Supplementary Tests (For Reference)
Typical Load Tests 230V
Test #
12V
5V
3.3V
5VSB
DC/AC (Watts)
Efficiency
Fan Speed (RPM)
PSU Noise (dB[A])
Temps (In/Out)
PF/AC Volts
1
1.542A
1.969A
1.953A
0.998A
39.986
73.119%
1433
36.5
30.14°C
0.832
11.927V
5.080V
3.375V
5.012V
54.686
34.15°C
230.29V
2
4.115A
2.957A
2.944A
1.201A
80.009
80.797%
1576
39.2
31.04°C
0.923
11.934V
5.073V
3.362V
4.997V
99.025
35.59°C
230.28V
3
7.037A
3.448A
3.447A
1.405A
119.938
83.718%
1577
39.2
31.11°C
0.953
11.921V
5.075V
3.351V
4.983V
143.265
36.29°C
230.27V
4
9.974A
3.937A
3.952A
1.609A
159.969
84.813%
1738
42.3
31.90°C
0.967
11.909V
5.078V
3.340V
4.970V
188.614
37.65°C
230.26V
5
12.540A
4.933A
4.961A
1.816A
199.988
85.057%
1834
43.1
32.51°C
0.975
11.921V
5.068V
3.326V
4.955V
235.123
38.82°C
230.26V
6
15.094A
5.931A
5.975A
2.000A
239.811
85.016%
1934
45.2
32.93°C
0.980
11.934V
5.059V
3.313V
4.940V
282.076
39.49°C
230.26V
7
17.656A
6.932A
7.002A
2.233A
279.991
84.757%
2028
46.6
33.56°C
0.983
11.944V
5.050V
3.300V
4.924V
330.344
40.85°C
230.25V
8
20.209A
7.938A
8.034A
2.444A
319.971
84.345%
2108
46.0
34.09°C
0.986
11.954V
5.040V
3.285V
4.907V
379.359
42.10°C
230.25V
9
23.229A
8.428A
8.548A
2.450A
359.901
84.035%
2147
47.0
34.39°C
0.987
11.943V
5.042V
3.274V
4.897V
428.276
43.26°C
230.26V
10
26.219A
8.920A
9.102A
2.559A
399.971
83.556%
2188
47.9
35.24°C
0.988
11.930V
5.044V
3.262V
4.883V
478.684
44.51°C
230.26V
11
29.646A
8.899A
9.129A
2.564A
439.826
83.102%
2193
48.0
35.70°C
0.989
11.895V
5.057V
3.252V
4.874V
529.261
45.55°C
230.25V
CL1
3.999A
14.001A
13.998A
0.000A
163.588
78.458%
2086
47.2
32.40°C
0.971
12.344V
4.862V
3.297V
4.960V
208.504
38.54°C
230.27V
CL2
30.000A
0.999A
1.000A
1.000A
359.918
85.106%
1992
45.7
35.86°C
0.987
11.548V
5.236V
3.305V
4.942V
422.907
44.81°C
230.27V
The results above are not used in the certification process
Light Load Tests 230V
Test #
12V
5V
3.3V
5VSB
DC/AC (Watts)
Efficiency
Fan Speed (RPM)
PSU Noise (dB[A])
PF/AC Volts
1
1.255A
0.486A
0.486A
0.199A
19.980
64.472%
1083
28.1
0.688
11.824V
5.131V
3.386V
5.033V
30.990
230.30V
2
2.505A
0.977A
0.975A
0.398A
39.969
74.916%
1293
33.6
0.826
11.846V
5.119V
3.379V
5.024V
53.352
230.30V
3
3.755A
1.468A
1.466A
0.598A
60.000
79.889%
1174
30.8
0.889
11.866V
5.108V
3.373V
5.015V
75.104
230.30V
4
4.997A
1.960A
1.960A
0.799A
79.950
82.184%
1238
32.1
0.921
11.878V
5.100V
3.367V
5.006V
97.282
230.29V
The results above are not used in the certification process
Ripple Measurements 230V
Test
12V
5V
3.3V
5VSB
Pass/Fail
10% Load
23.00mV
16.00mV
8.20mV
12.60mV
Pass
20% Load
25.30mV
14.50mV
8.30mV
45.50mV
Pass
30% Load
26.30mV
15.30mV
8.60mV
13.20mV
Pass
40% Load
27.30mV
15.40mV
9.10mV
13.50mV
Pass
50% Load
29.90mV
16.60mV
9.90mV
13.40mV
Pass
60% Load
32.50mV
17.10mV
10.60mV
13.40mV
Pass
70% Load
35.60mV
19.40mV
11.50mV
14.10mV
Pass
80% Load
40.80mV
21.50mV
16.80mV
13.70mV
Pass
90% Load
43.20mV
27.30mV
17.90mV
42.90mV
Pass
100% Load
61.10mV
32.90mV
19.40mV
15.50mV
Pass
110% Load
61.40mV
35.10mV
20.50mV
15.80mV
Pass
Crossload1
44.10mV
29.00mV
18.30mV
14.00mV
Pass
Crossload2
50.30mV
24.40mV
13.80mV
16.10mV
Pass
The results above are not used in the certification process
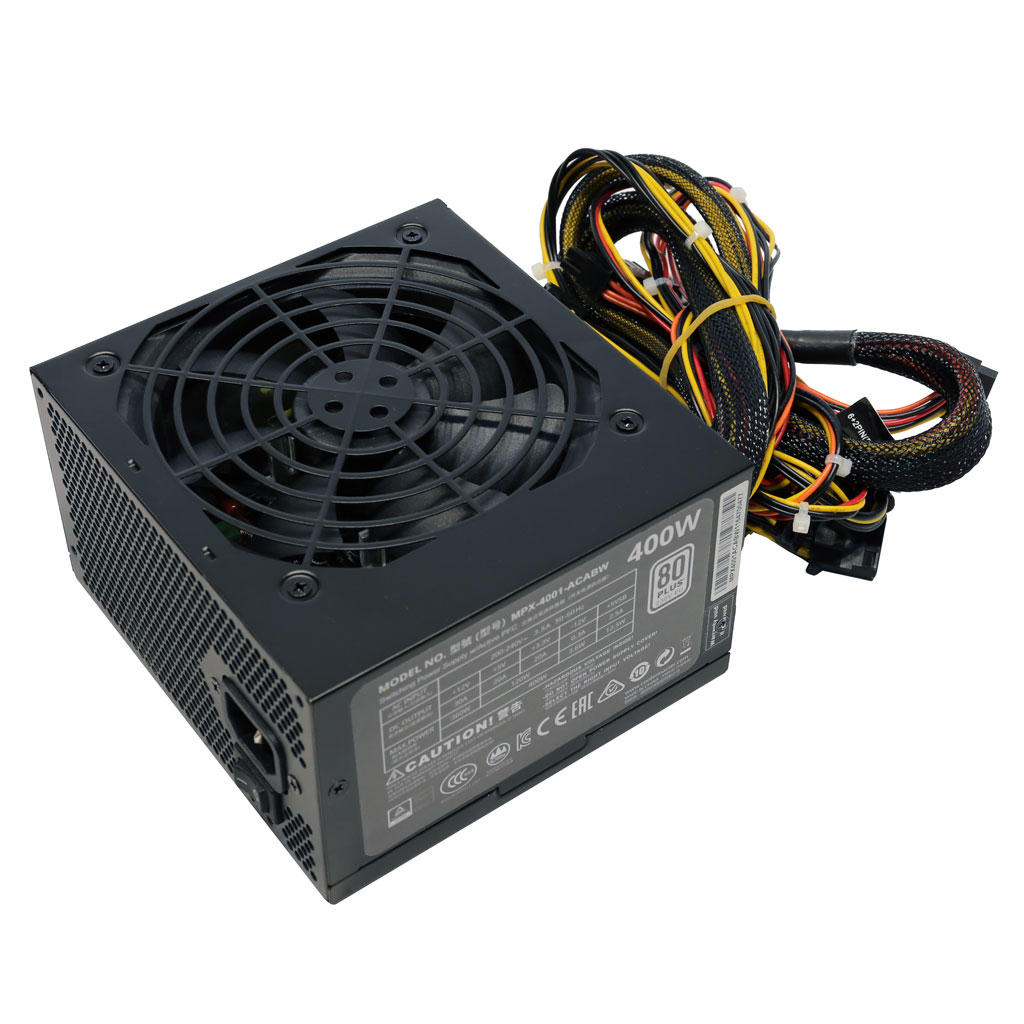
Cooler Master Masterwatt Lite 400W
Top side
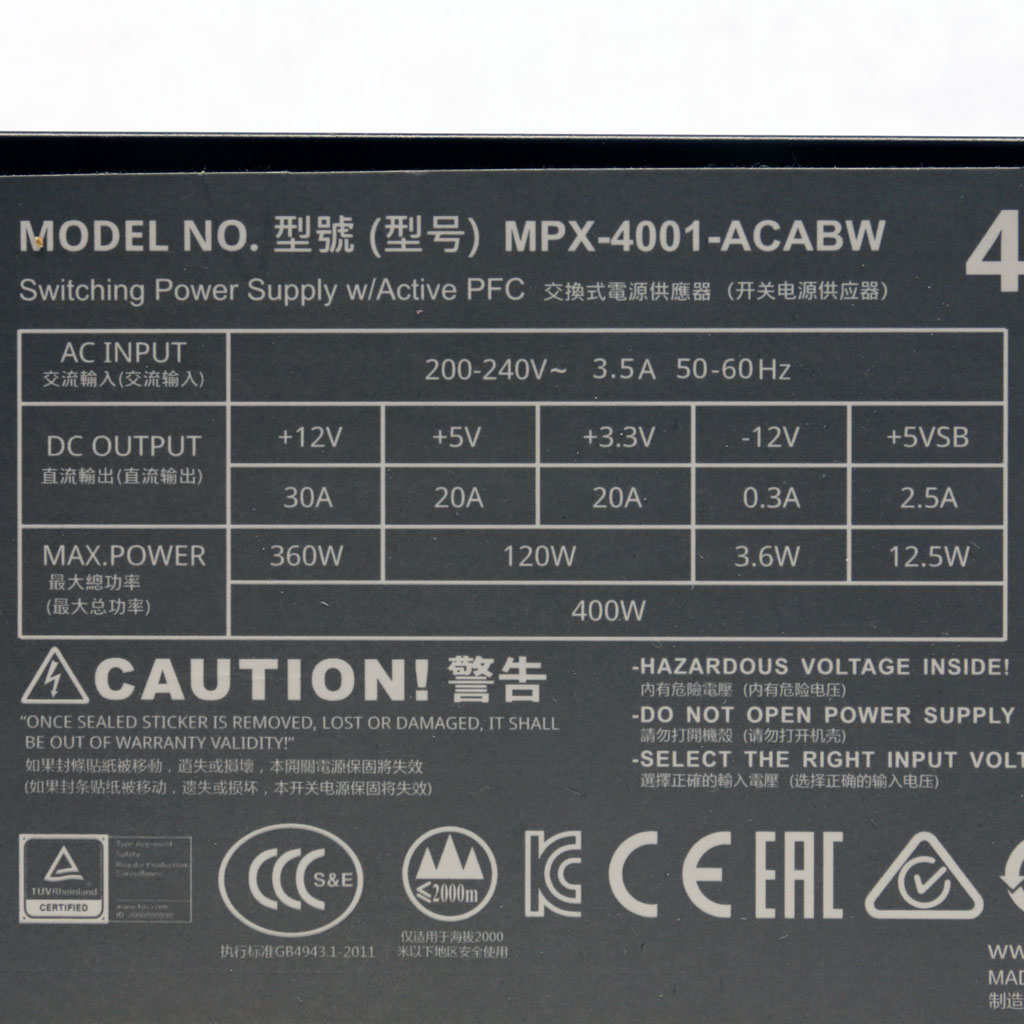
Power specifications label
All data and graphs included in this test report can be used by any individual on the following conditions: › It should be mentioned that the test results are provided by Cybenetics › The link to the original test results document should be provided in any case
Cybenetics offers the ETA and Lambda voluntary certification programs, through which the efficient and silent power supplies are promoted