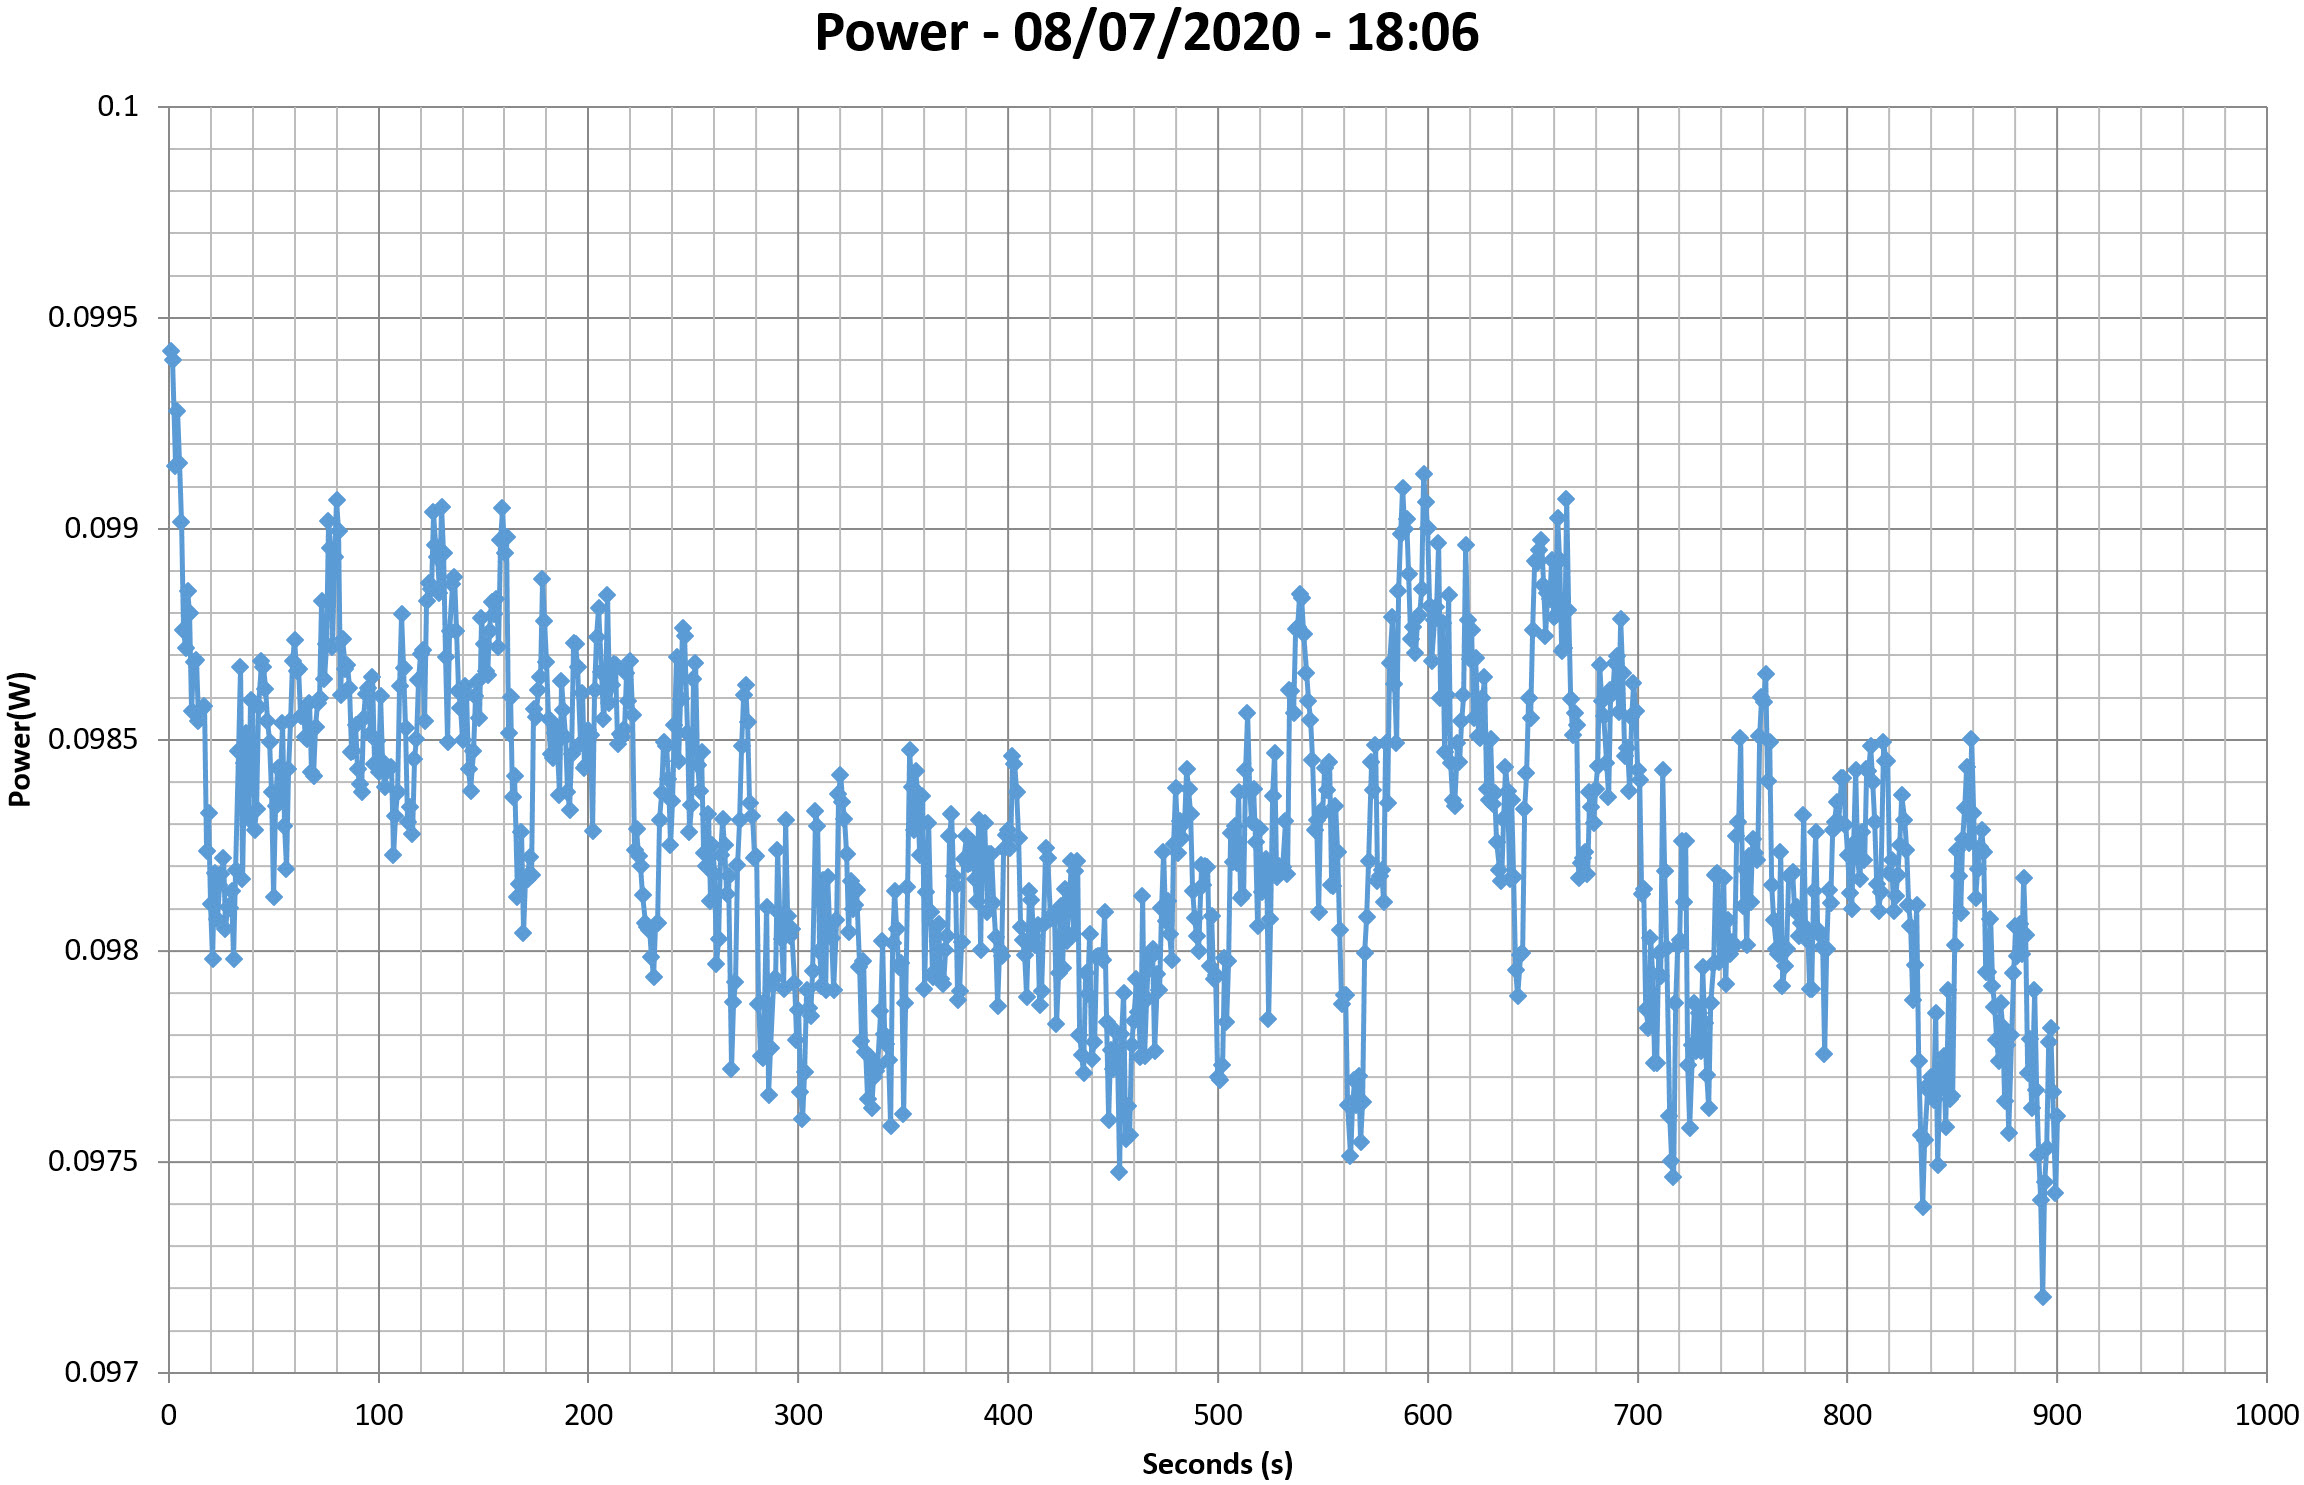
This graph is generated by the PPA Standby Power Analysis software which takes full control of the power analyzer during the whole procedure. This application features all of the EN50564 & IEC62301 test limits for standby power software testing
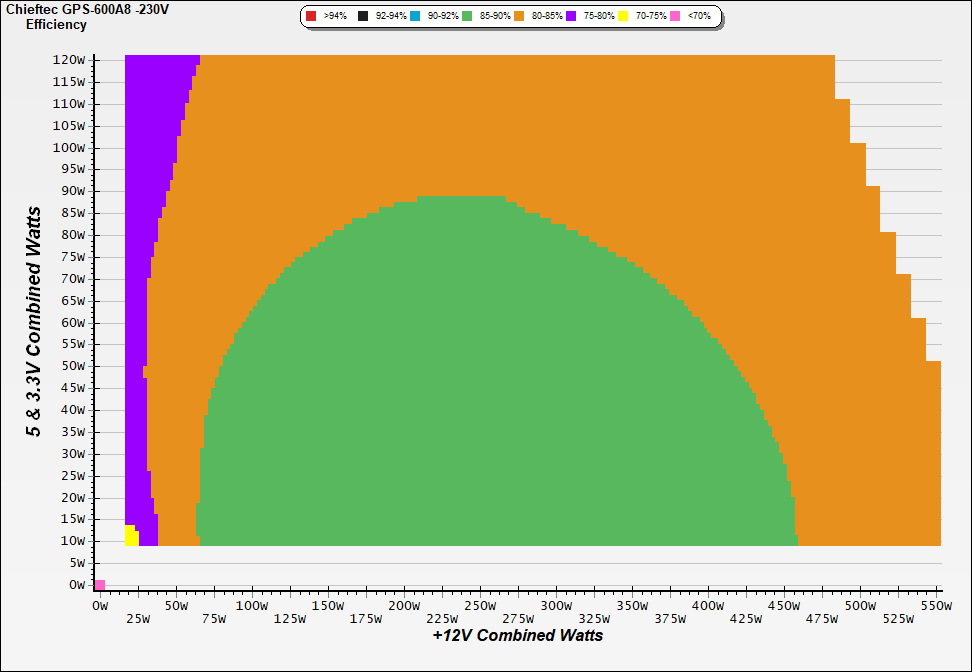
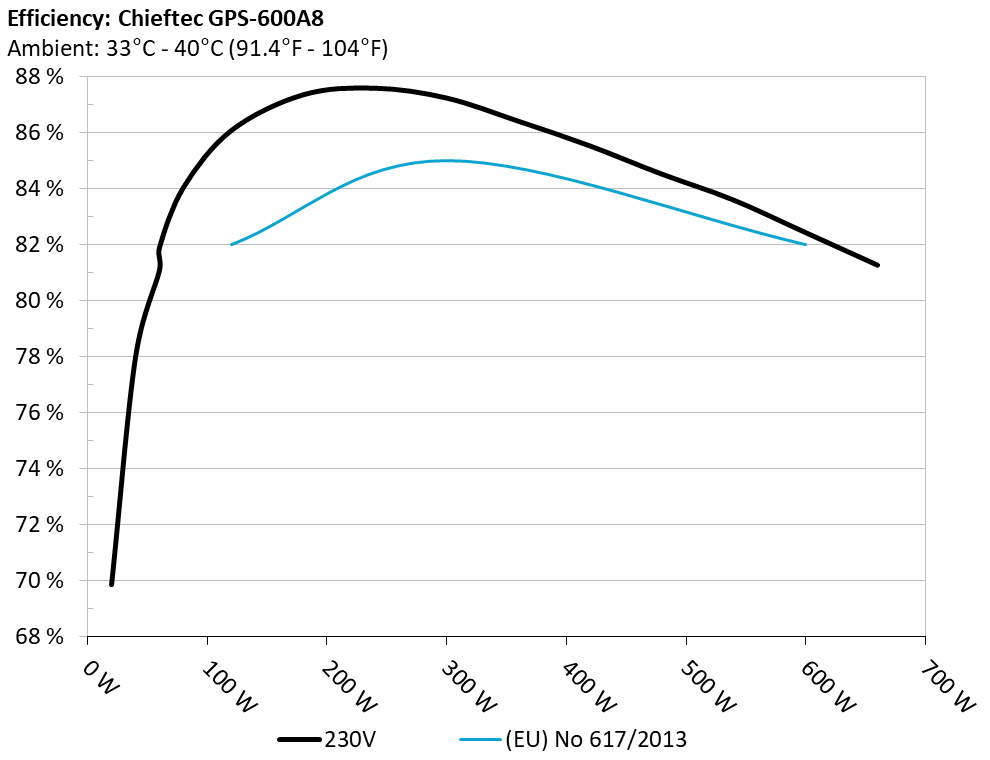
Efficiency Graph
230V
INFO
This graph depicts the PSU`s efficiency throughout its entire operational range. For the generation of the efficiency and noise graphs we set our loaders to auto mode through our custom-made software before trying thousands of possible load combinations
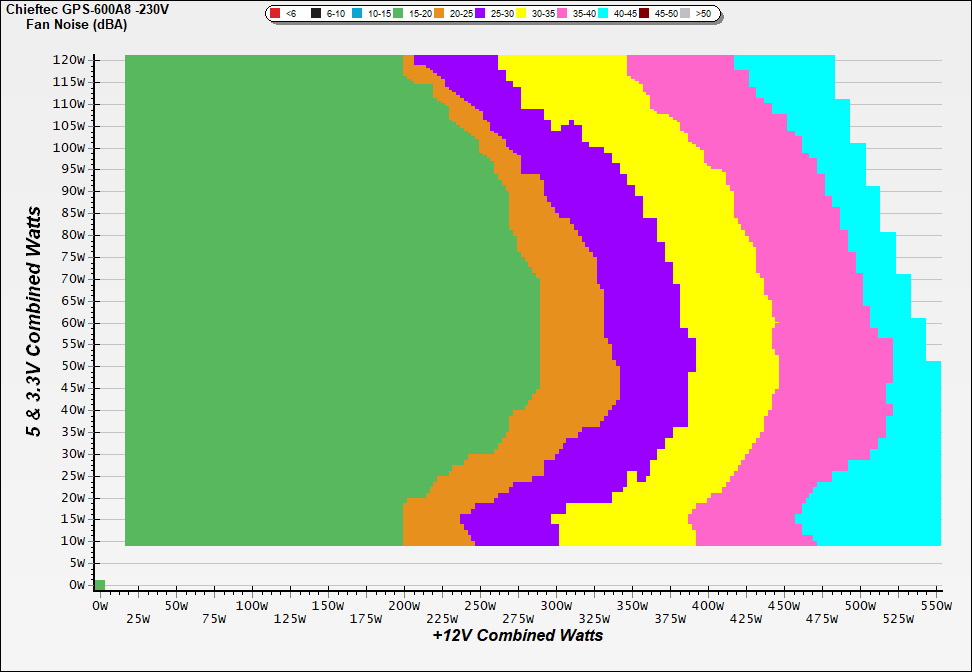
Noise Graph
230V
INFO
The PSU`s noise in its entire operational range and under 30-32 °C ambient is depicted in this graph. The X axis represents the load on the +12V rail(s) while the Y axis is the load on the minor rails
Indicative Performance
Efficiency under high ambient temperature
INFO
The PSU`s efficiency under high ambient temperatures with 115V and 230V input. For this graph the results of the 10-110% load regulation table are used
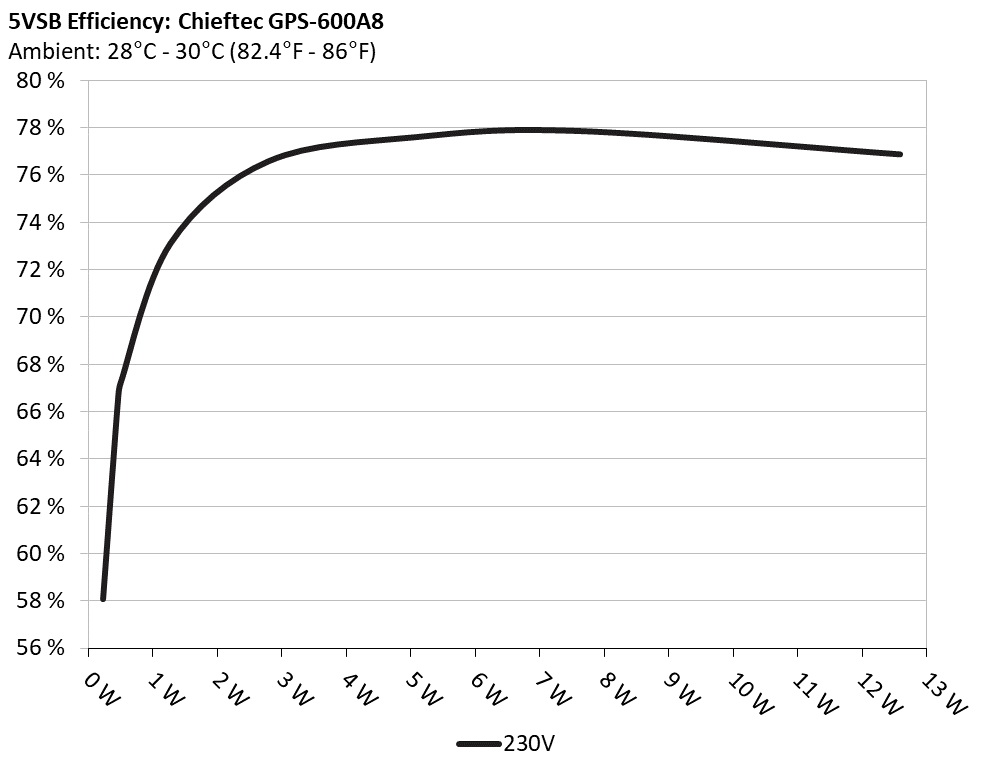
5VSB Efficiency
INFO
This graph depicts the efficiency levels of the 5VSB rail with 115V and 230V input
5VSB Efficiency (ERP LOT 3/6 & CEC) 230V
Test #
5VSB
DC/AC (Watts)
Efficiency
PF/AC Volts
1
0.045A
0.230
58.081%
0.024
5.100V
0.396
230.25V
2
0.090A
0.459
66.425%
0.042
5.098V
0.691
230.25V
3
0.550A
2.797
76.567%
0.182
5.085V
3.653
230.26V
4
1.000A
5.073
77.581%
0.257
5.072V
6.539
230.26V
5
1.500A
7.591
77.840%
0.304
5.060V
9.752
230.26V
6
2.500A
12.582
76.855%
0.352
5.032V
16.371
230.25V
Supplementary Tests (For Reference)
Typical Load Tests 230V
Test #
12V
5V
3.3V
5VSB
DC/AC (Watts)
Efficiency
Fan Speed (RPM)
PSU Noise (dB[A])
Temps (In/Out)
PF/AC Volts
1
3.186A
1.968A
1.951A
0.990A
60.013
81.089%
918
19.8
35.48°C
0.698
12.058V
5.080V
3.382V
5.051V
74.009
37.81°C
230.26V
2
7.404A
2.966A
2.940A
1.193A
120.047
86.090%
918
19.8
35.72°C
0.918
12.040V
5.059V
3.367V
5.029V
139.443
38.71°C
230.26V
3
12.003A
3.468A
3.446A
1.398A
180.052
87.370%
920
20.0
36.26°C
0.979
11.996V
5.049V
3.353V
5.007V
206.080
39.67°C
230.26V
4
16.636A
3.970A
3.952A
1.605A
240.065
87.606%
921
20.0
36.95°C
0.987
11.954V
5.038V
3.339V
4.985V
274.029
41.16°C
230.26V
5
20.914A
4.986A
4.967A
1.815A
300.104
87.253%
921
20.0
37.31°C
0.989
11.934V
5.016V
3.323V
4.959V
343.946
42.29°C
230.26V
6
25.198A
6.010A
5.990A
2.000A
359.939
86.427%
1135
26.8
37.96°C
0.989
11.916V
4.993V
3.306V
4.935V
416.466
43.47°C
230.26V
7
29.474A
7.046A
7.026A
2.243A
419.757
85.542%
1407
32.6
38.10°C
0.990
11.896V
4.970V
3.289V
4.907V
490.703
44.16°C
230.26V
8
33.830A
8.002A
8.068A
2.460A
479.840
84.534%
1747
38.8
38.83°C
0.991
11.878V
4.948V
3.273V
4.881V
567.630
45.65°C
230.26V
9
38.621A
8.617A
8.599A
2.470A
539.571
83.612%
2083
43.6
39.39°C
0.991
11.834V
4.934V
3.257V
4.861V
645.328
46.72°C
230.26V
10
43.539A
9.149A
9.168A
2.585A
600.293
82.438%
2223
44.8
39.81°C
0.991
11.784V
4.921V
3.240V
4.837V
728.177
47.50°C
230.25V
11
48.960A
9.150A
9.209A
2.595A
660.308
81.275%
2211
44.7
40.20°C
0.991
11.705V
4.920V
3.226V
4.819V
812.436
48.89°C
230.26V
CL1
0.097A
14.003A
14.000A
0.000A
113.154
74.844%
961
21.9
37.63°C
0.938
13.205V
4.663V
3.327V
5.011V
151.187
42.05°C
230.27V
CL2
46.008A
1.000A
1.001A
0.000A
531.296
84.739%
936
20.5
40.06°C
0.992
11.365V
5.124V
3.287V
4.961V
626.982
48.31°C
230.26V
The results above are not used in the certification process
Light Load Tests 230V
Test #
12V
5V
3.3V
5VSB
DC/AC (Watts)
Efficiency
Fan Speed (RPM)
PSU Noise (dB[A])
PF/AC Volts
1
1.237A
0.488A
0.485A
0.197A
20.001
69.848%
915
19.8
0.426
12.008V
5.117V
3.396V
5.089V
28.635
230.27V
2
2.471A
0.979A
0.973A
0.394A
39.991
77.983%
915
19.8
0.574
12.017V
5.105V
3.390V
5.077V
51.282
230.26V
3
3.706A
1.473A
1.463A
0.593A
60.023
81.900%
917
19.8
0.694
12.025V
5.093V
3.385V
5.065V
73.288
230.26V
4
4.935A
1.968A
1.954A
0.792A
79.974
84.048%
916
19.8
0.791
12.030V
5.082V
3.379V
5.053V
95.153
230.26V
The results above are not used in the certification process
Ripple Measurements 230V
Test
12V
5V
3.3V
5VSB
Pass/Fail
10% Load
5.80mV
5.60mV
9.20mV
6.30mV
Pass
20% Load
6.00mV
5.40mV
9.30mV
6.30mV
Pass
30% Load
6.80mV
5.80mV
10.00mV
9.00mV
Pass
40% Load
8.70mV
5.70mV
11.10mV
9.60mV
Pass
50% Load
9.20mV
5.80mV
11.20mV
11.10mV
Pass
60% Load
10.20mV
6.40mV
13.20mV
11.60mV
Pass
70% Load
14.00mV
7.20mV
14.10mV
12.20mV
Pass
80% Load
13.50mV
8.10mV
17.20mV
13.70mV
Pass
90% Load
15.60mV
10.70mV
18.00mV
13.80mV
Pass
100% Load
17.90mV
12.20mV
21.80mV
15.50mV
Pass
110% Load
20.60mV
14.60mV
21.60mV
16.90mV
Pass
Crossload1
8.10mV
11.40mV
15.10mV
7.00mV
Pass
Crossload2
17.80mV
8.90mV
19.40mV
12.50mV
Pass
The results above are not used in the certification process
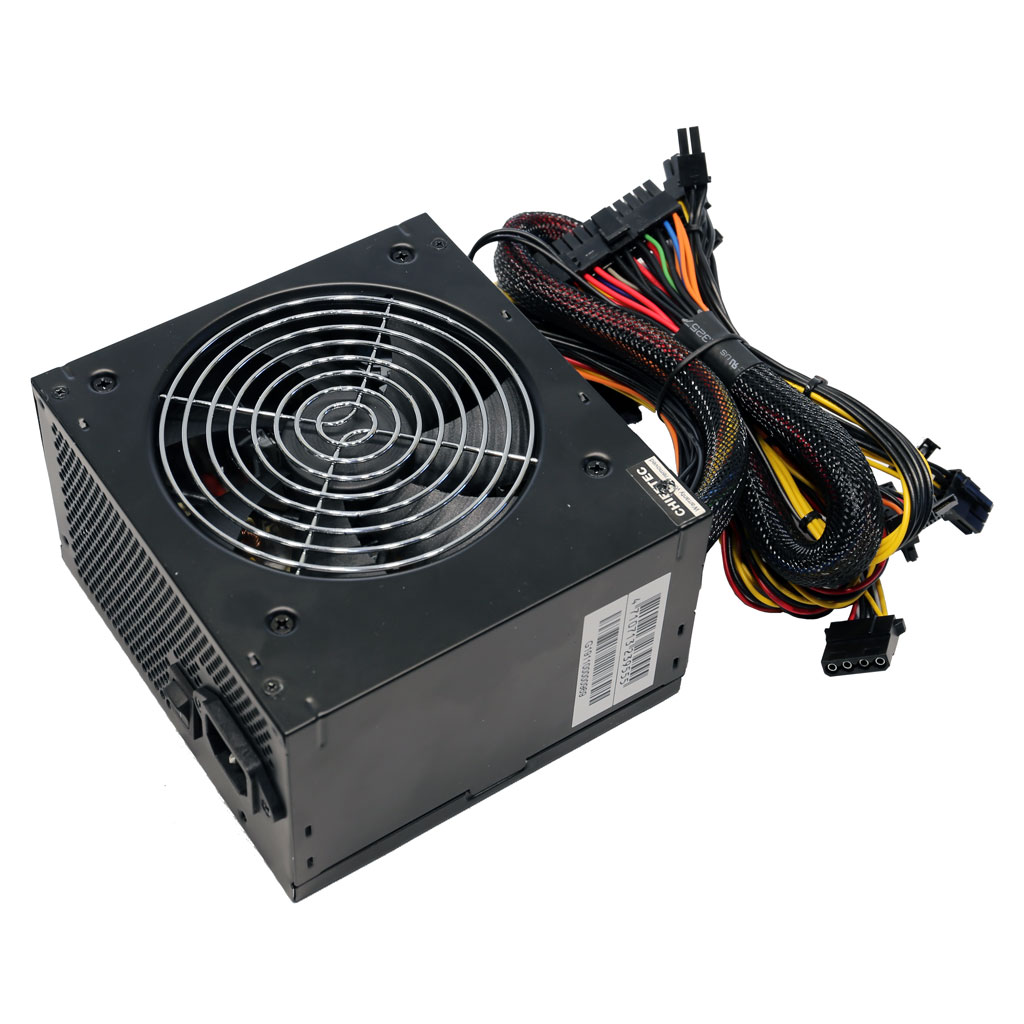
Chieftec Smart 600W
Top side
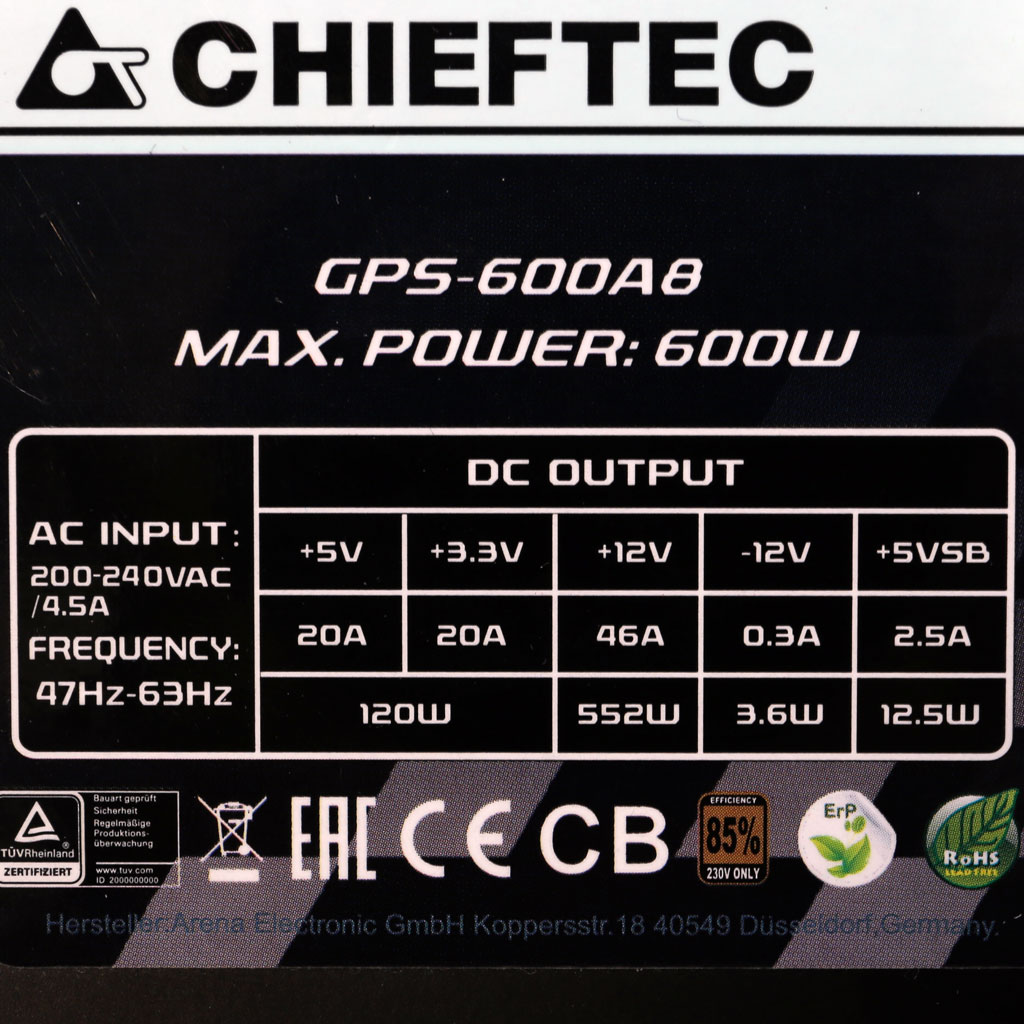
Power specifications label
All data and graphs included in this test report can be used by any individual on the following conditions: › It should be mentioned that the test results are provided by Cybenetics › The link to the original test results document should be provided in any case
Cybenetics offers the ETA and Lambda voluntary certification programs, through which the efficient and silent power supplies are promoted